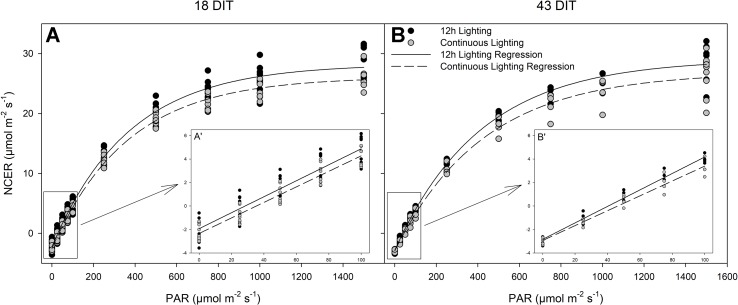
Figure 6.
Photosynthetic light response curves from leaves grown under either 12 h lighting (200 µmol m−2 s−1 red + 50 µmol m−2 s−1 blue, 06:00–18:00) and CL (200 µmol m−2 s−1 red, 06:00–18:00 + 50 µmol m−2 s−1 blue, 18:00–06:00) at 18 DIT (panel A) and 43 DIT (panel B) as determined using a Li-COR 6400 with a red/blue standard Li-COR light source. Measurements were made at a CO2 concentration of 800 µl L−1, leaf temperature of 24°C, and a relative humidity of 55–65%. Regression lines were fit to y = yo + a(1 − e(−b*x)) for each light treatment. Insert A’ and B’ are magnifications of 0–100 µmol m−2 s−1 PAR regions fit to the regression line y = mx + b.

