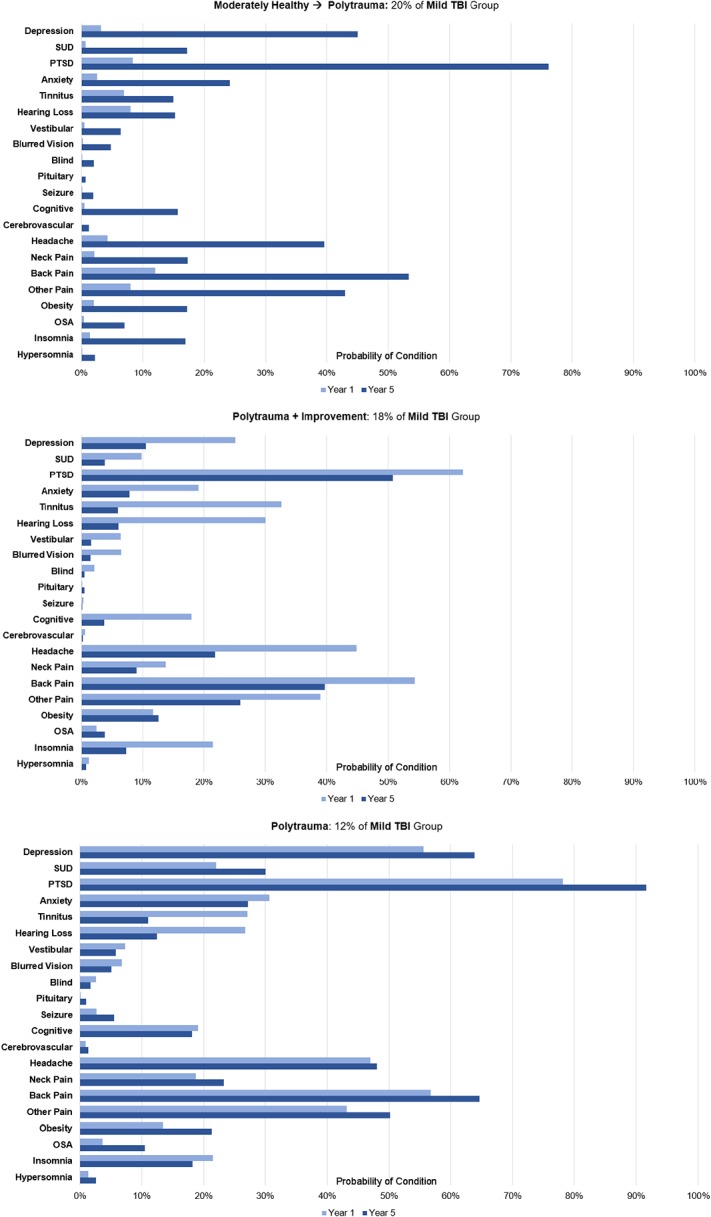
Fig 4. Distinct comorbidity phenotypes in mTBI cohorts.

Figure shows the probability that an individual within a phenotype was diagnosed with each condition in year 1 and year 5 of VHA care.

Figure shows the probability that an individual within a phenotype was diagnosed with each condition in year 1 and year 5 of VHA care.