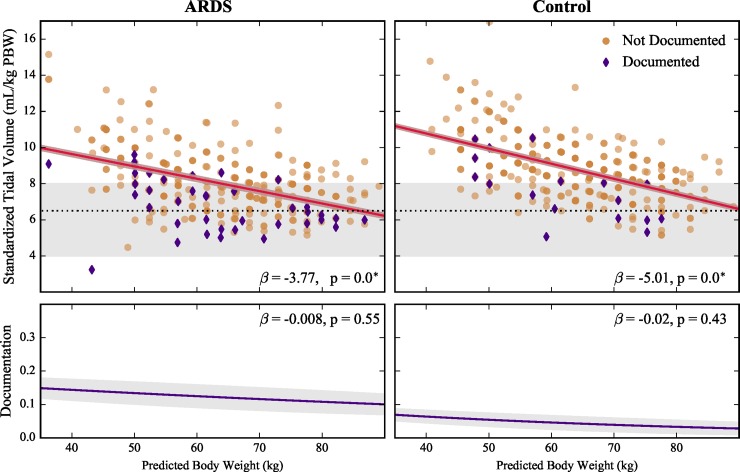
Fig 3. Effects of predicted body weight (gender neutral height) on standardized tidal volume () and ARDS documentation in ARDS and control cohorts.
Top panels show patients with ARDS documented in their chart (purple diamonds) and non-documented patients (tan circles). Gray areas represent LTVV range from current guidelines[7], with dashed line at 6.5 mL/kg PBW at current recommended threshold. Solid lines show linear () and logistic (documentation) fits for scatter plot data (shaded regions, 95% confidence bands). Reported beta coefficients are for standardized inputs. * p < 0.0003.

