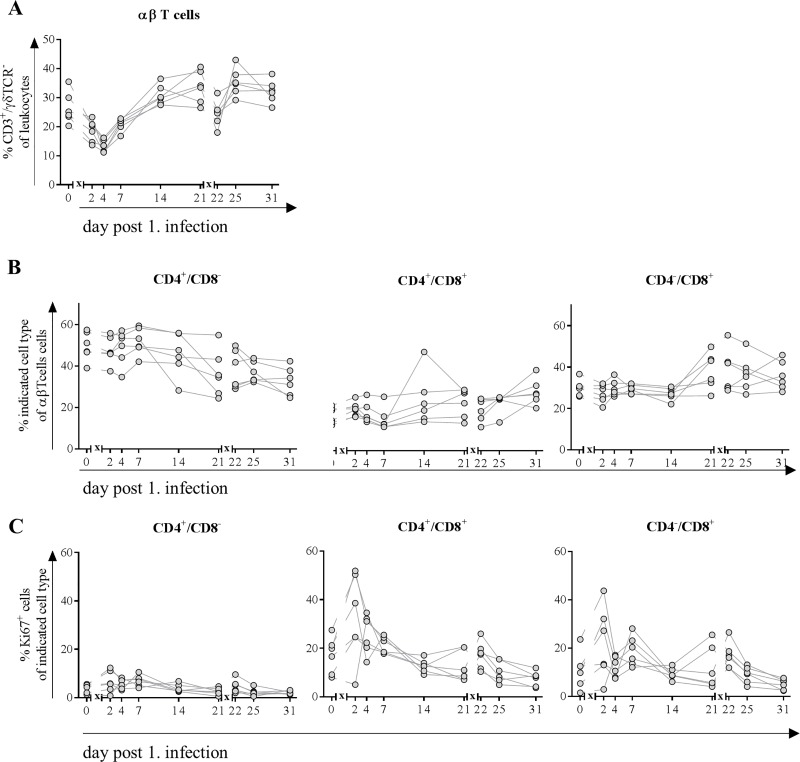
Fig 6.
Frequencies of αβ T cells (A), their subpopulations (B) expressing Ki67 (C). At indicated time points, blood was collected from the same six pigs, randomly chosen on day 0. Flow cytometric analyses were performed to determine frequency of CD3+/ γδTCR- T cells (A). Further classification (B) was made based on the expression of CD4+ single positive cells (naive Th cells), CD4+/CD8+ (memory as well as cytotoxic T cells) and CD4-/CD8+ cytolytic T cells. Expression of Ki67 (C) indicated proliferative capacity of cells. x in graph axis indicates infection.

