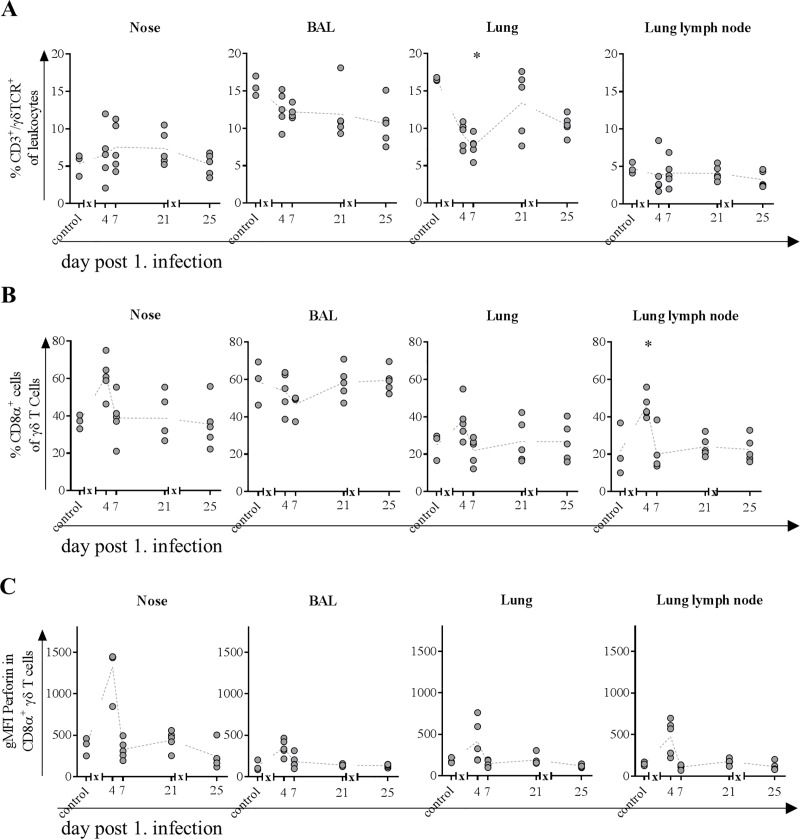
Fig 9.
Frequencies of γδ T cells (A) and CD8α+ subpopulation (B) expressing perforin (C). At indicated time points, three to five animals were subjected to necropsy. After preparation of single cell suspensions from nasal mucosa, BAL, lung tissue and lung lymph node, flow cytometric analyses were performed to determine frequency of CD3+/ γδTCR+ T cells (A). The CD8α expressing subpopulation (B) was further tested for intracellular perforin expression (C). * = p≤0.05 Kruskal-Wallis test followed by Dunn’s post hoc test compared to control. x in graph axis indicates infection.

