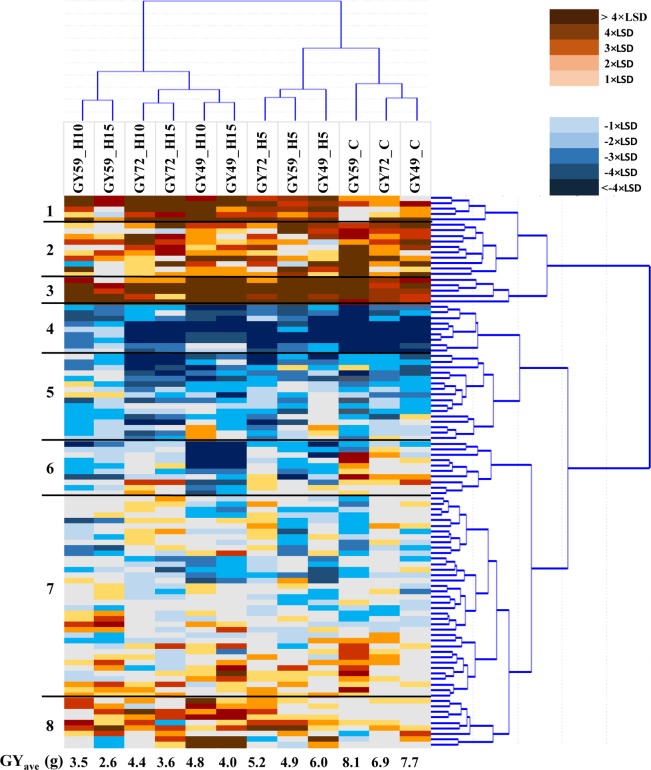
Fig 4. Heatmap of average grain yield/plant (g) across wheat genotypes and treatments.
Rows represent 101 wheat genotypes and columns the various treatments expressed as the difference between the individual genotype and the main GY average of each treatment (within a Column). The main GY average of each treatment (g) is represented at the bottom of each column. C—Control, H5—H10—H15—Heat stress lasting 5, 10 and 15 days; (Zadoks) 49—Booting stage, 59—Heading, 72—Early milk development; GY—Grain yield; LSD—Least significant difference at P = 0.05.

