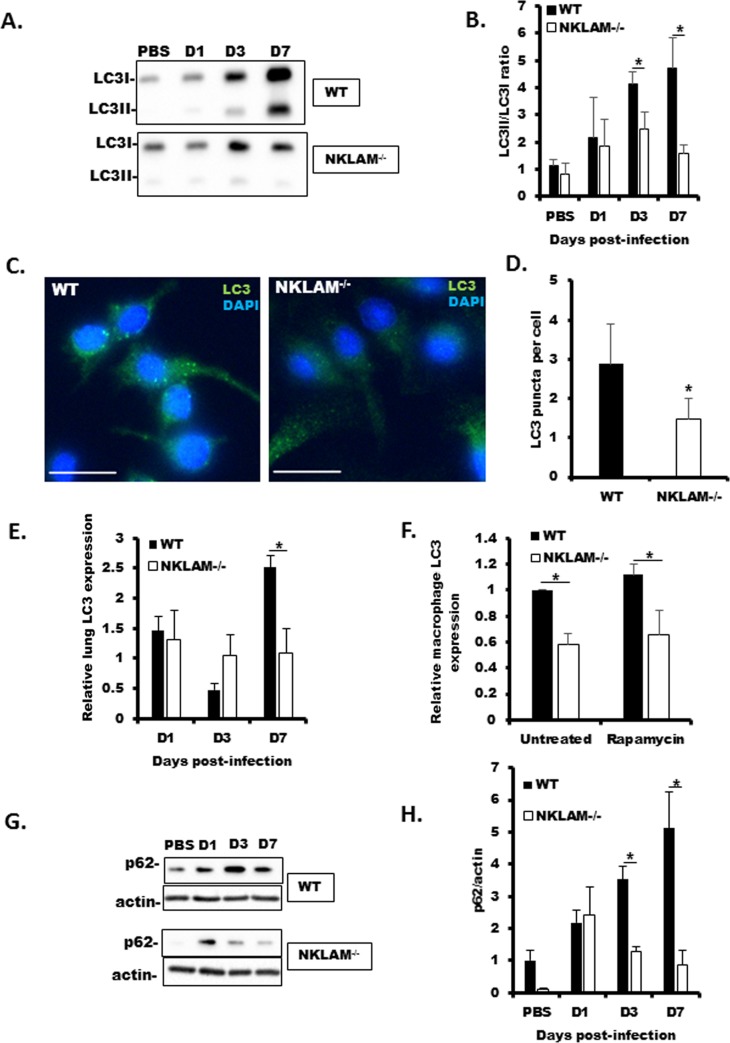
Fig 7. Autophagy marker LC3 expression is less in NKLAM-/- mice and BMDM.
WT and NKLAM-/- mice were infected with 500 pfu SeV/gram body weight and the conversion of LC3I to LC3II was determined by Western blot. A representative blot is shown in A. The ratio of LC3II/LC3I is shown graphically in B. n = 3 mice per group; * p < 0.05; comparing NKLAM-/- and WT mice. C) WT and NKLAM-/- BMDM were treated with 5 μg/ml rapamycin for 18h and stained for LC3 (green). Nuclei were counterstained with DAPI (blue). The number of LC3 puncta/cell was quantified using ImageJ. At least 250 cells were counted for each condition (D). White bar is 15 μm; * p ≤ 0.05. Data represent 3 independent experiments. E) RNA isolated from lung homogenate from SeV-infected lungs was used to determine LC3 expression by qPCR. F) WT and NKLAM-/- BMDM were treated with 5 μg/ml rapamycin for 18h. LC3 protein expression was determined by Western blot and normalized to total protein using TCE. WT untreated values were set to 1. Data represent 3 separate experiments. SeV-infected lung homogenate was used to determine p62 expression by Western blot (G) and by qPCR (H). mRNA levels (mean ± SD) are expressed relative to PBS-treated mice; n = 3 mice per group; * p ≤ 0.05; comparing NKLAM-/- and WT mice.

