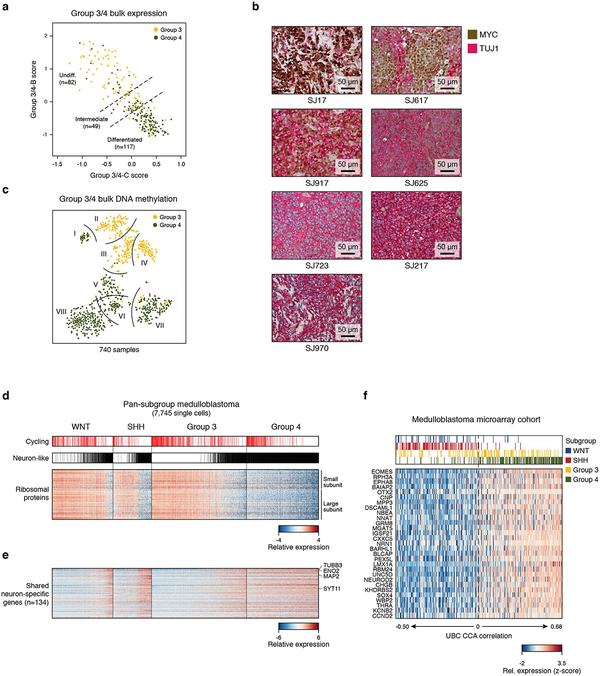
ED Figure 9 |. Analysis of Group 3/4 intermediate samples and pan-subgroup comparison.
a, Scatterplot of the meta-program Group 3/4-C (x-axis) and Group 3/4-B (y-axis) expression scores for Group 3 and Group 4 bulk MBs3 (n=248; yellow and green dots, respectively). Samples that score similarly for both programs are classified as intermediate samples (n=49) b, Representative MYC and TUJ1 (encoded by TUBB3) IHC images of seven Group 3/4 samples. Four of these samples are shown at higher magnification in Figure 5b (SJ17, SJ617, SJ625, SJ723). c, Two-dimensional representation of 740 Group 3/4 MB samples analyzed by DNA methylation profiling using t-SNE3. Eight subtypes are delineated by curved lines. Samples are colored by their predicted subgroup35. d, Heatmap showing expression of transcripts coding for ribosomal proteins (n=75, rows). Cells positive for the cell cycle programs, and cells classified as neuron-like cells are indicated on top. Cells are ordered as in Figure 6b (n=7,745). e, Heatmap showing relative expression levels of genes that are specific to neuron-like cells and are shared between multiple subgroups (n=134, rows). Cells are ordered as in panel (e). f, Heatmap shows the relative expression of UBC-specific genes in Figure 6d (n=30; rows) in the bulk expression array cohort (n=392; columns). Samples are ordered by increasing CCA cosine correlation coefficient.

