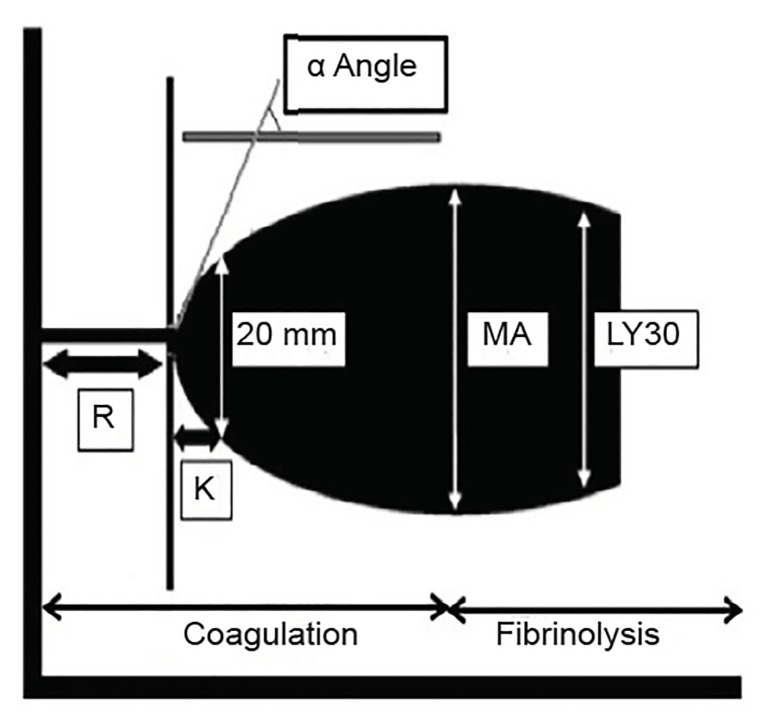
Figure 2.
Thromboelastography (TEG)/rotational thromboelastometry graphic.
R, reaction time, represents the time until initial fibrin formation. R reflects the coagulation factor levels present in the individual; K, coagulation time, from R until the amplitude of the TEG reaches 20 mm; MA, maximum amplitude, describes the maximum strength of the clot and reflects platelet function and fibrinogen activity; α angle, measures the speed of fibrin accumulation and cross linking and assesses the rate of clot formation; LY30, percentage diminution of the amplitude at 30 minutes after the maximum amplitude has been reached. LY30 represents a measure of the degree of fibrinolysis.10

