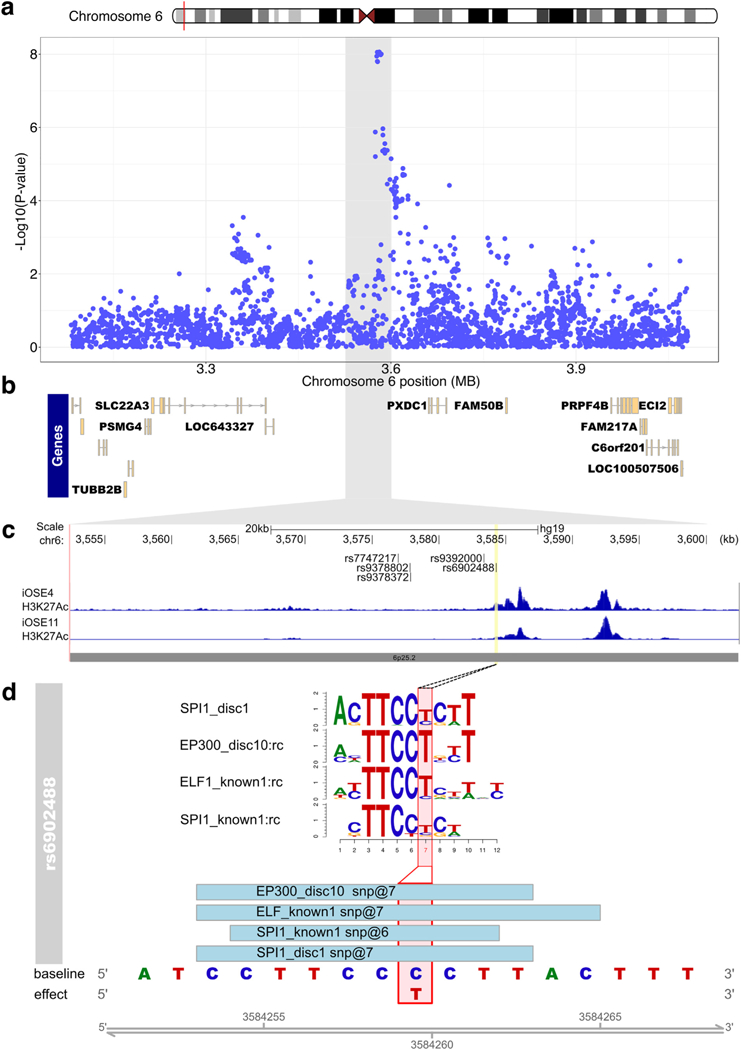
Fig. 2.

Functional annotation of risk variants at the 6p25.2 risk locus. (a) Regional association plot for serous cancers, centered on rs7748275, with genes in the regions indicated in panel (b). The grey highlighted region corresponds indicates the interval on chromosome 6 in panel a that is shown in panel (c). (c) ChIP-seq in OC-relevant cell types. The locations of the top 6 candidate causal alleles are indicated. (d) SNP rs6902488 significantly alters binding sites for 4 transcription factors. Position weight matrices are shown for each, the height of each letter indicates the importance of that base in the motif.
