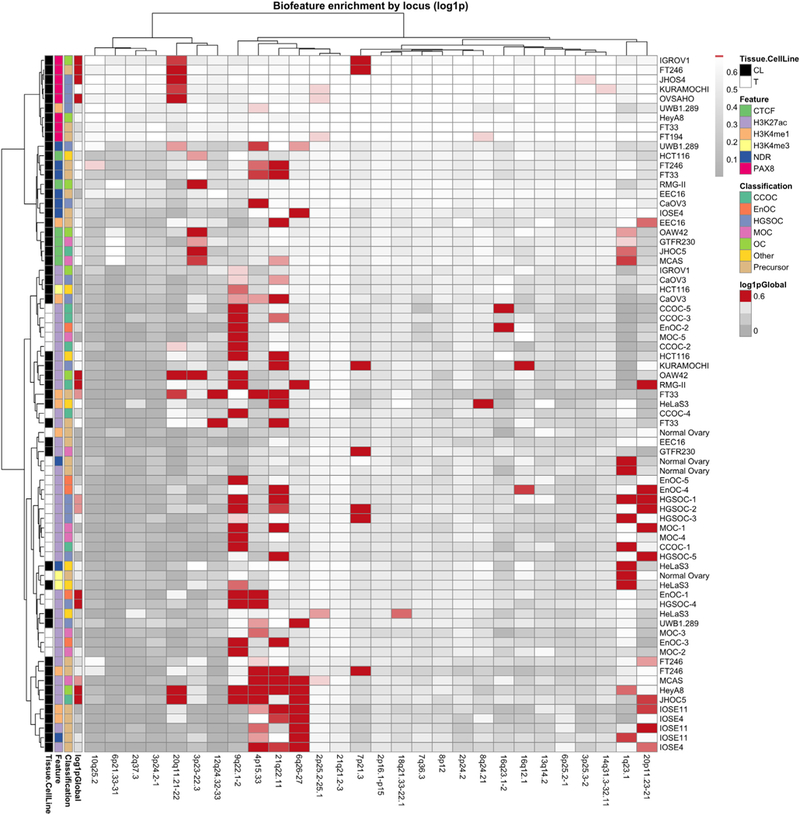
Fig. 3.

Risk loci can be stratified by biofeature enrichment patterns. All loci with BFDP <0.5 were intersected with 73 biofeature data sets for EOC-relevant cell types. Red color indicates a statistically significant enrichment of SNPs within a certain biofeature (rows) for a particular locus (columns). Global enrichment for all loci collectively is indicated on the far left of the heatmap. Clustering was performed to aggregate loci that exhibit similar patterns of enrichment, using the Ward method. CL, cell line; NDR, nucleosome depleted region; T, tumor.
