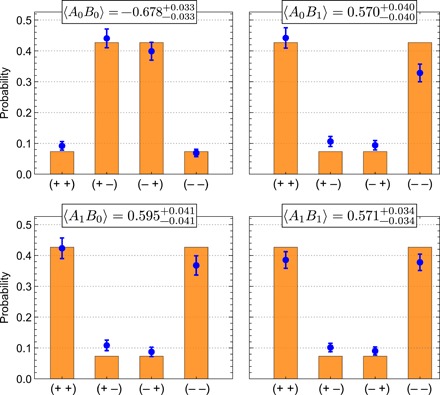
Fig. 3. Experimental data.

The outcome probabilities comprising each of the four expectation values 〈A0B0〉, 〈A0B1〉, 〈A1B0〉, and 〈A1B1〉 are obtained from the measured sixfold coincidence events for each set of 4 × 4 eigenvectors during a fixed time window. Shown here are only the data corresponding to nonzero eigenvalues labeled on the horizontal axes + and − for +1 and −1, respectively, with the full data shown in the Supplementary Materials. The theoretical predictions are shown as orange bars, and each measured expectation value is given above the corresponding subfigure. Uncertainties on the latter and error bars on the data represent 1σ statistical confidence intervals assuming Poissonian counting statistics (see the Supplementary Materials).
