. 2019 Sep 6;8:e48627. doi: 10.7554/eLife.48627

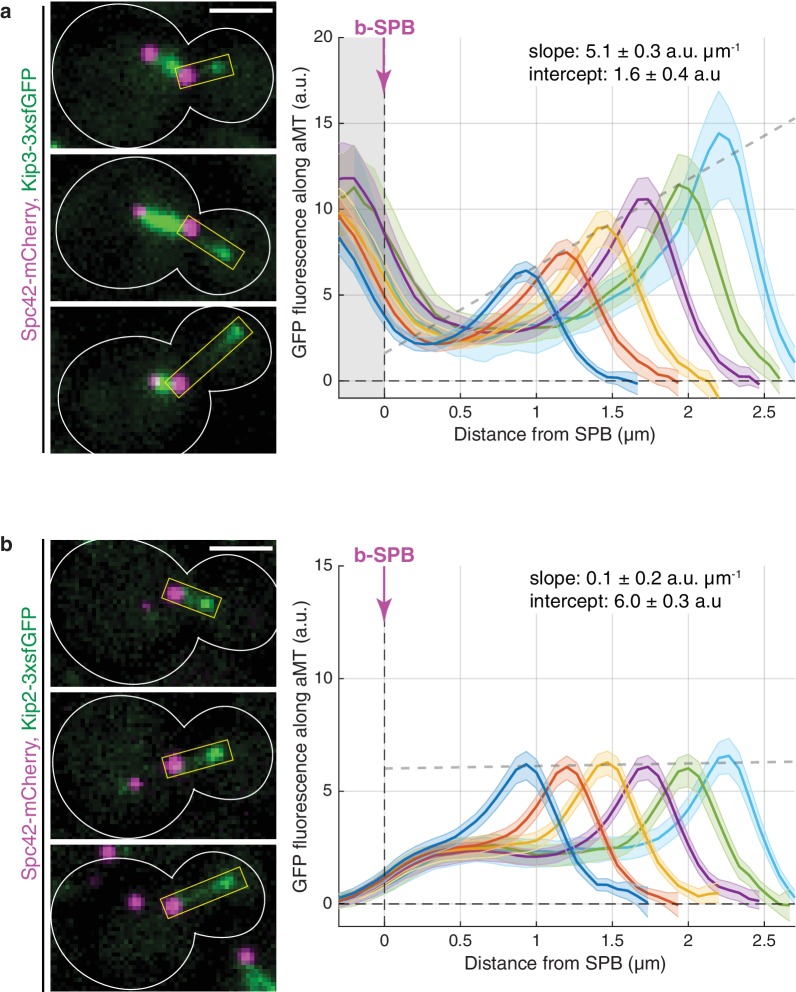
Figure 1. Kinesins Kip3 and Kip2 exhibit distinct localization patterns along microtubules in vivo.

(a, b) Representative images (left) and quantifications (right) of fluorescence intensities (a.u.) from endogenous Kip3-3xsfGFP (a) and Kip2-3xsfGFP (b) along preanaphase astral microtubules (aMTs; boxed areas). Signals were aligned to b-SPBs using the peak of Spc42-mCherry (magenta) intensity and binned by microtubule length (2-pixel = 266.7 nm bin size). Colored lines show mean Kip2/3-3xsfGFP fluorescence per bin and shaded areas represent 95% confidence intervals for the mean. Gray dashed lines denote weighted linear regressions for the mean GFP fluorescence on plus-ends over all bins. The area on the left of the vertical dashed line passing through x = 0 in (a) marks Kip3-3xsfGFP fluorescence inside nuclei. Scale bars, 2 µm. 10 ≤ n ≤ 130 per bin. See also Figure 1—figure supplement 1.

Figure 1.

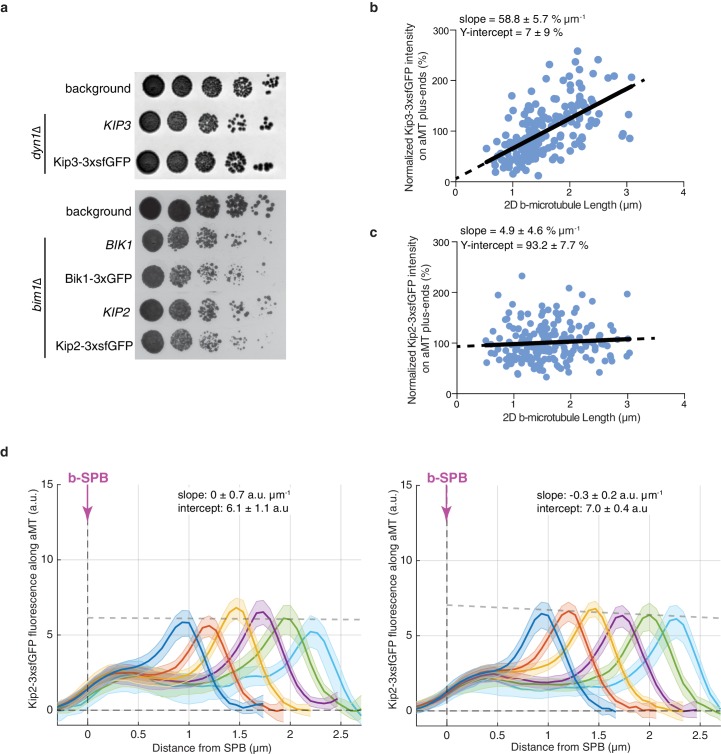
Figure 1—figure supplement 1. Functional analysis of endogenously tagged proteins and reproducibility of the kinesin distribution analysis in vivo.

Figure 1—figure supplement 1.

(a) Defective Kip3 is synthetic lethal with dyn1∆, whereas defective Kip2 or Bik1 is synthetic lethal with bim1∆. Here we show that the expression of the Kip3-3xsfGFP, Kip2-3xsfGFP, and Bik1-3xGFP proteins does not cause synthetic growth defect or lethality with dyn1∆ or bim1∆. Spot growth assay of background cells (Spc72-GFP) and cells of indicated genotype for two days on solid YPD agar at 30°C. Spots are from exponentially growing cell samples that were sequentially diluted five-fold. (b, c) Scatterplots with fitted linear regression lines (black) between two-dimensional (2D) b-microtubule length and normalized Kip3-3xsfGFP (b) or Kip2-3xsfGFP (c) intensity on b-microtubule plus-ends (%). Kip3-3xsfGFP shows a significant positive correlation (p<0.0001, n = 183 cells) in contrast to Kip2-3xsfGFP, which shows no significant correlation (p=0.3, n = 200 cells). In addition, Kip3-3xsfGFP is nearly absent on very short microtubules, whereas Kip2-3xsfGFP is equally abundant on microtubules of all lengths. (d) Technical replicates for the quantifications of fluorescence intensities (a.u.) from endogenous Kip2-3xsfGFP along preanaphase b-microtubules. The signals were processed and presented as in Figure 1, and fluorescence intensities were normalized (see Materials and methods) to the data shown in Figure 1. Left panel: 15 ≤ n ≤ 69 per bin, right panel: 47 ≤ n ≤ 98 per bin.