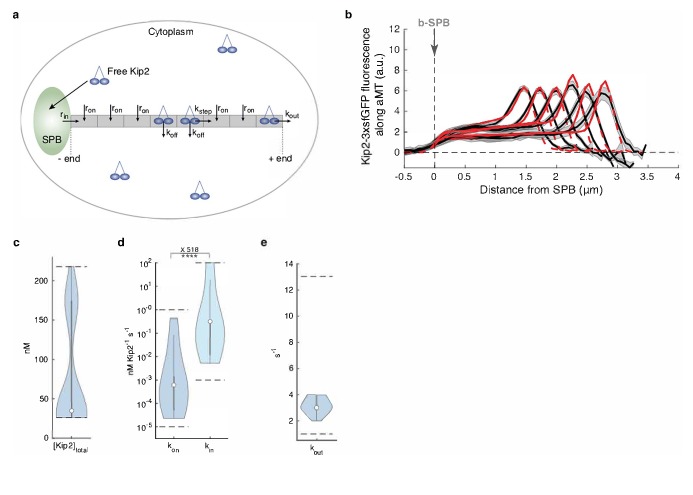
Figure 2. Mathematical model predicts recruitment of Kip2 to the microtubule minus-end.
(a) Schematic of the mathematical model. Free Kip2 (with concentration ) binds to the microtubule minus-end anchored at the SPB with rate if the minus-end site is free, and to any free lattice site with rate . A bound motor can detach with rate , and it can advance with rate if the next site towards the plus-end is free. At the plus end, the motor detaches with a different rate, . (b) Experimental Kip2-3xsfGFP fluorescence (a.u.) mean profile (black) and standard error (gray) with respective mean in silico model fits (red) for microtubules binned by length. Red dashed lines past plus-end and SPB indicate model extrapolations without support by data. (c) Likelihood of total Kip2 concentration estimated from fit in (b). (d) Likelihood of on rate constant and in rate constant estimated from in silico model fit in (b). Statistical significance for , ****, (p<5∙10−5) determined by sampling from the likelihood (see Appendix 1), difference in median as indicated. (e) Likelihood of out rate constant estimated from in silico model fit in (b). For in silico model parameter estimate plots (cde), median parameter values are indicated as circles, inter-quartile range () by thick gray bars and by thin gray bars. Kernel density estimates are computed from 20’000 samples from the likelihood function. Sampled parameter ranges are indicated by dashed black lines. See also Figure 2—figure supplement 2, Figure 2—figure supplement 1, and Figure 2—figure supplement 3.


