. 2019 Aug 15;8:e48220. doi: 10.7554/eLife.48220

Figure 4. Widespread variation in the mom-2(RNAi) phenotype.

(A) Spectrum of mom-2(RNAi) effects across the C. elegans isolates. The effects of mom-2(RNAi) are quantified as the average percentage of arrested embryos with endoderm (y-axis). Each column represents the mean for each wild isolate (n > 500 embryos were scored for each experiment with at least two replicates per isotype). (B) Comparison of mom-2(RNAi) phenotype using two different gut markers (birefringent gut granules and MH33 immunostaining of IFB-2) in three different genetic backgrounds. In all cases, no significant statistical difference was found between the two quantitative methods. Fisher’s exact test (NS p-value>0.05). (C) Comparison of the effect of mom-2(or42) on endoderm development after introgression into four different genetic backgrounds. At least three independent introgressed lines were studied for each wild isotype. The results were compared to N2; mom-2(or42). Student t-test (*** p-value<0.001).

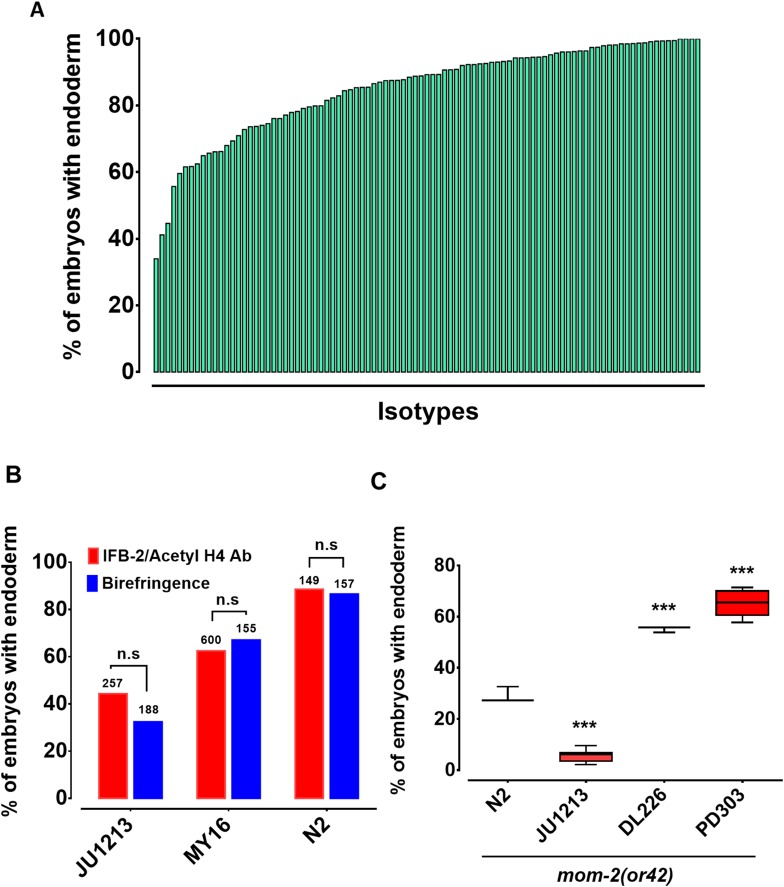
Figure 4.

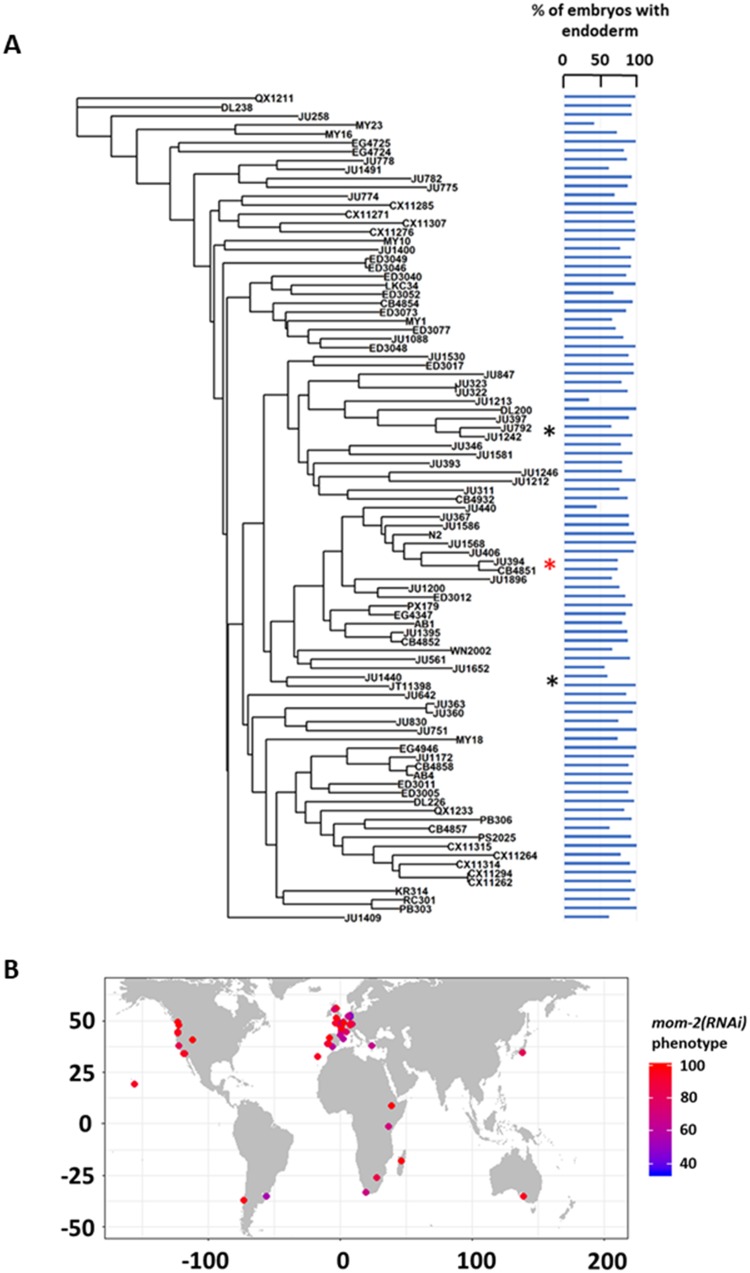
Figure 4—figure supplement 1. MOM-2 requirement does not correlate with genotypic relatedness or geographical location.

Figure 4—figure supplement 1.

(A) mom-2(RNAi) phenotype of 94 isolates arranged with respect to the neighbor-joining tree constructed using 4,690 SNPs and pseudo-rooted to QX1211. Red asterisk indicates an example of closely related strains (JU394 and CB4851) with similar phenotypes, while black asterisks indicate examples sister strains (JU792 and JU1242; JU1440 and JT11398) with distinct phenotypes (λ = 6.94×10^−05, p-value=1). (B) Worldwide distribution of mom-2(RNAi) phenotype across 94 isolates. Each circle represents a single isolate.
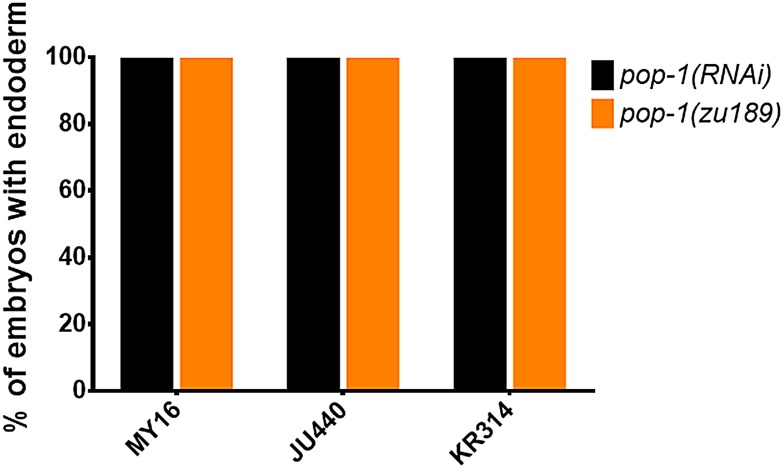
Figure 4—figure supplement 2. The requirement for POP-1 in endoderm formation does not vary in three introgressed strains.

Figure 4—figure supplement 2.

Strains are shown on the x-axis and fraction of arrested embryos with endoderm are shown on the y-axis. The orange bars represent the results from mutant lines: MY16;pop-1(zu189), JU440;pop-1(zu189), and KR314;pop-1(zu189). Four introgressed lines were created for each new mutant strain. Black bars represent pop-1(RNAi) results on the wild isolates indicated. >200 embryos were scored per experiment.