. 2019 Aug 15;8:e48220. doi: 10.7554/eLife.48220

Figure 5. Genome-Wide Association Studies of skn-1(RNAi) and mom-2(RNAi) phenotypes.

(A) Manhattan plot of skn-1(RNAi) GWAS. The red line indicates a genome-wide 1.5% FDR (permutation-based FDR, from 10,000 permutated results). Black line represents 3.0% FDR. The y axis is the –log10 of p-value. (B) Manhattan plot of mom-2 (RNAi) EMMA. The y axis is the –log10 of p-value. Genomic regions are shown on the x-axis. (C) Effect plots of the most strongly-linked SNPs from mom-2(RNAi) GWAS at position 3,362,389 bp on chromosome I and position 17,924,783 bp on chromosome V. Horizontal lines within each box represent the median, and the boxes represent 25th–75th percentile.

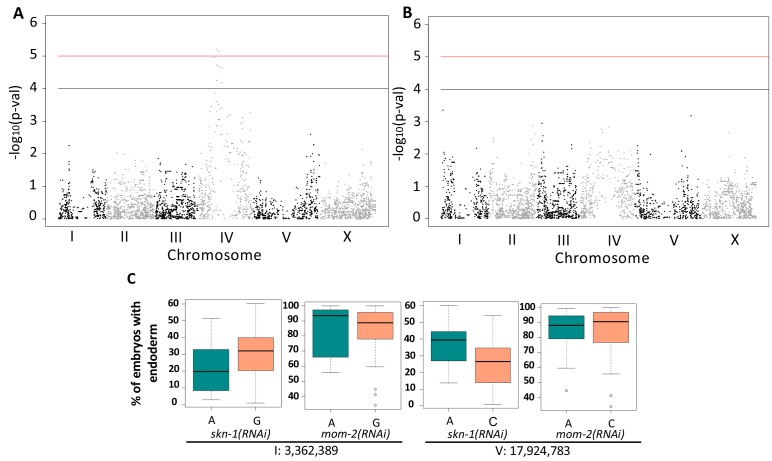
Figure 5.

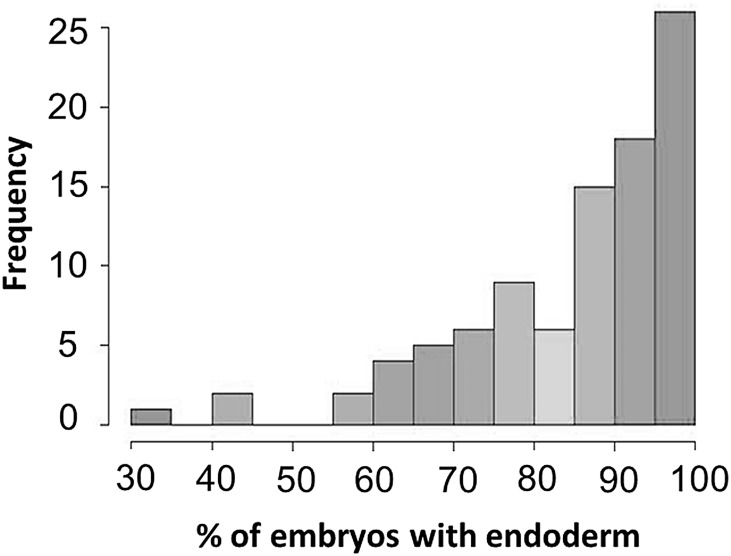
Figure 5—figure supplement 1. Histogram of mom-2(RNAi) phenotype among the 94 wild isolates.

Figure 5—figure supplement 1.

A beta-distribution is observed (skewed to the right). Shapiro-Wilk normality test (W = 0.8682, p-value=1.207×10⁻⁷).
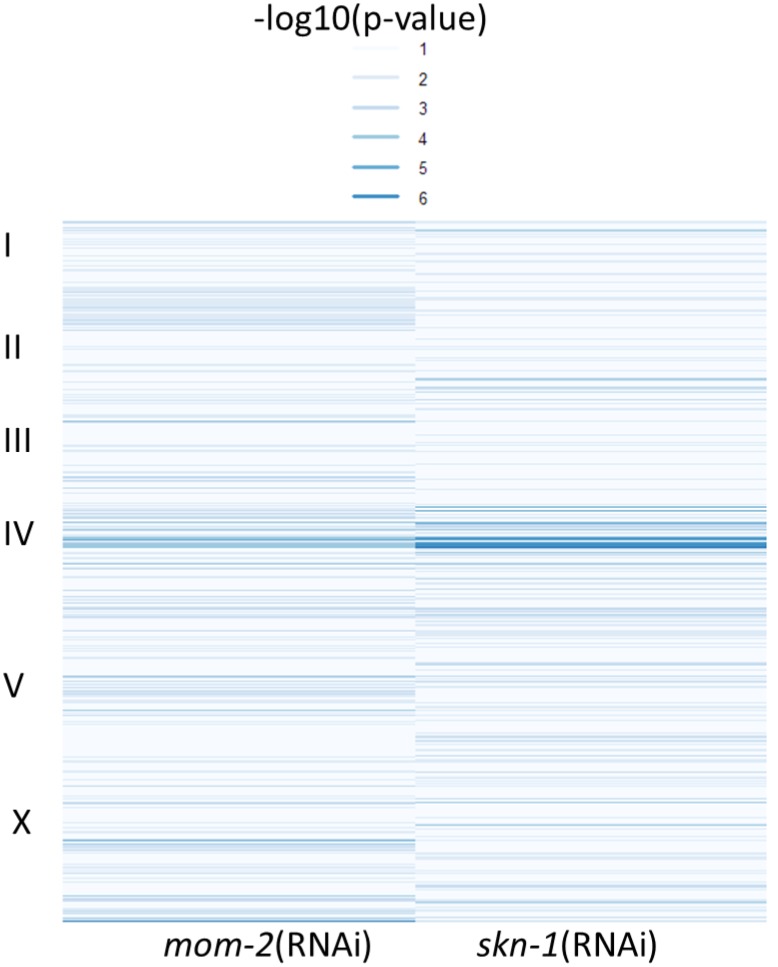
Figure 5—figure supplement 2. Comparison of EMMA p-values for both mom-2 and skn-1 RNAi phenotypes.

Figure 5—figure supplement 2.

Heatmap of p-values for mom-2(RNAi) (left) and skn-1(RNAi) (right) as calculated in the GWAS analyses (see Figure 5A,B). Strength of association between genotype and endoderm formation phenotypes is represented as –log10(p-value), here depicted as a heatmap (lighter colors – weaker association, darker colors – stronger association). An overlap (indicated by arrowhead) is found in a small region of chromosome IV, but no further correlations are observed. Significant SNPs for skn-1(RNAi) GWAS are shown in Table 1.