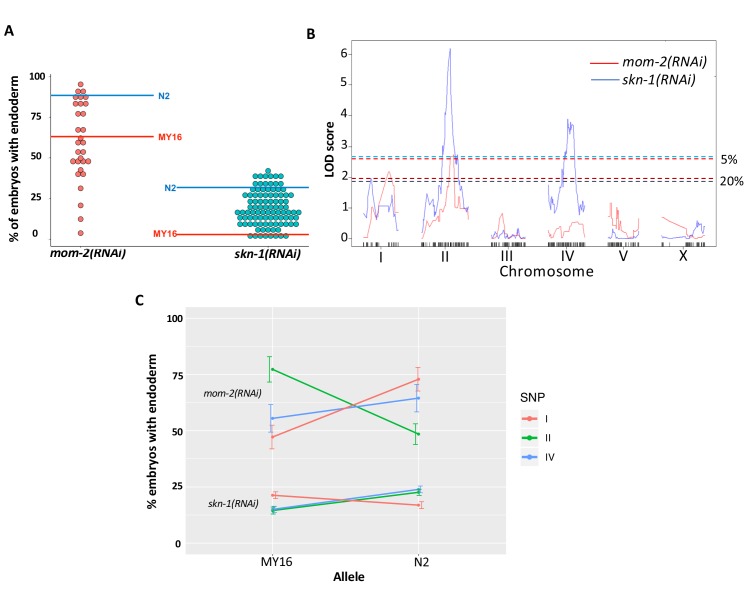
Figure 6. Quantitative genetic analysis of mom-2(RNAi) and skn-1(RNAi) phenotype in Recombinant Inbred Lines (RILs) between N2 and MY16.
(A) mom-2(RNAi) (left) and skn-1(RNAi) (right) phenotype of RILs. The phenotype of the parental strains, MY16 and N2 are shown by red and blue lines, respectively. (B) QTL analyses (interval mapping) of skn-1(RNAi) (blue line) and mom-2(RNAi) (red line) phenotype shown in (A). Genomic regions are shown on the x-axis and LOD score is shown on the y-axis. Significance thresholds for mom-2(RNAi) and skn-1(RNAi) at 5% and 20% linkage represented in red and blue dashed lines, respectively. (C) Effect plots of significant SNPs from mom-2(RNAi) and skn-1(RNAi), indicated by chromosome number and color, showing the direction of the allelic effects. Confidence intervals for the average phenotype in each genotype group are shown.

