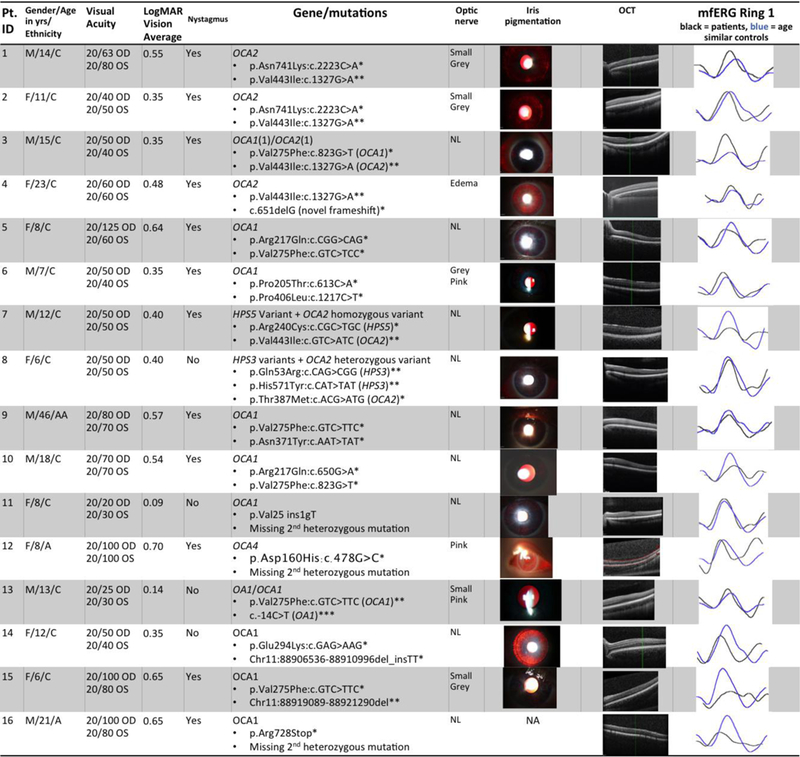
Fig.1. Summary of albinism patients’ clinic data.

Pt. ID= study identification number for each patient. Yrs = years. M=male, F=female; C=Caucasian, AA=African American, A=Asian. OU=both eyes. Best corrected visual acuity was tested using Snellen letters.
Column “LogMAR Vision (OU)” shows the visual acuity after conversion using the formula LogMAR=- Log(Decimal Acuity)+0.02*X-0.02*Y, where X=number of letters missed on the line, Y=number of letters discerned correctly on the following line
Column “Nystagmus” indicates presence of nystagmus or lack thereof
Column “Gene/mutations” contains albinism genes and mutations
– OCA = Oculocutaneous albinism
– HPS = Hermansky-Pudlak Syndrome
– * = known disease-causing mutation or novel frameshift or stop mutation
– ** = likely disease-causing but also prevalent in general population
– *** = likely a benign sequence variant
– Patient 3 also has a hypomorphic allele in OCA1 (p.Arg402Gln:c. 1205G>A) Column “optic nerve” contains descriptions of optic nerves for albinism patients on fundoscopic exam
– NL= normal
Column “Iris pigmentation” contains images of slit lamp photographs demonstrating iris transillumination
– Patient #6 and Patient #10 iris photographs digitally enhanced in PowerPoint or Zeiss Forum respectively by increasing brightness and contrast levels by 20%; no other photograph was altered from original
Column “OCT” contains optical coherence tomography scans of retinal anatomy demonstrating the range of foveal development in albinism study participants
Column “mfERG Ring 1” shows the mfERG waveform for the centermost ring for patients as compared to age similar controls in this study. Each normal waveform is therefore from a different controls subject, age similar to the patient whose waveform is shown. Black=patient, blue=control
