
Fig.2. Multifocal ERG change in amplitude from Ring 1 through 6 in patients and controls.
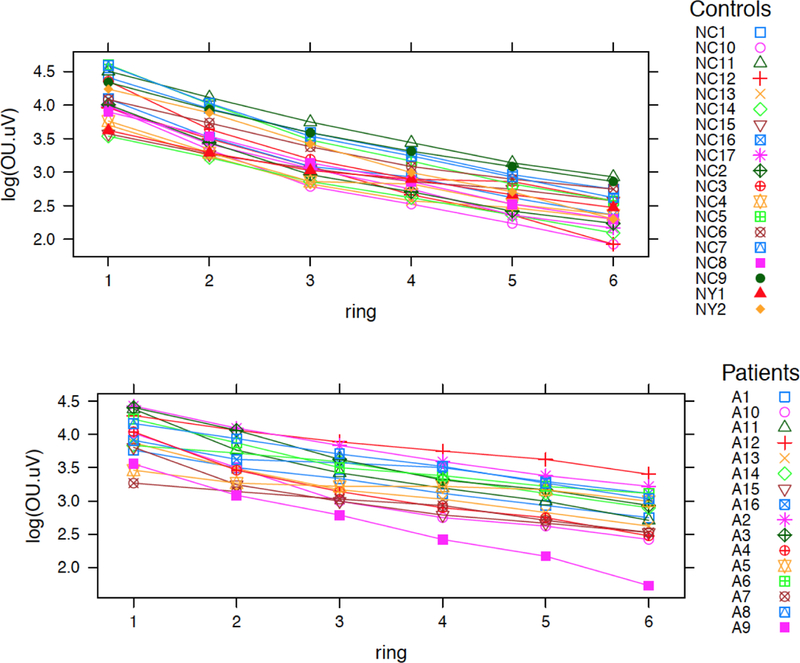
This figure was produced in R. It juxtaposes decrease in amplitudes from the centermost ring (Ring 1) to the most peripheral ring (Ring 6) in albinism patients compared to controls. X-axis shows the Rings in ascending order. Y-axis is the amplitude for each ring on the logarithmic scale. Difference between rate of decrease for patients (lower) and controls (upper) was statistically significant with the controls having a steeper decrease towards the periphery (p = 3.2 × 10⁻¹²). Color coded symbols correspond to individual patients and controls as listed.