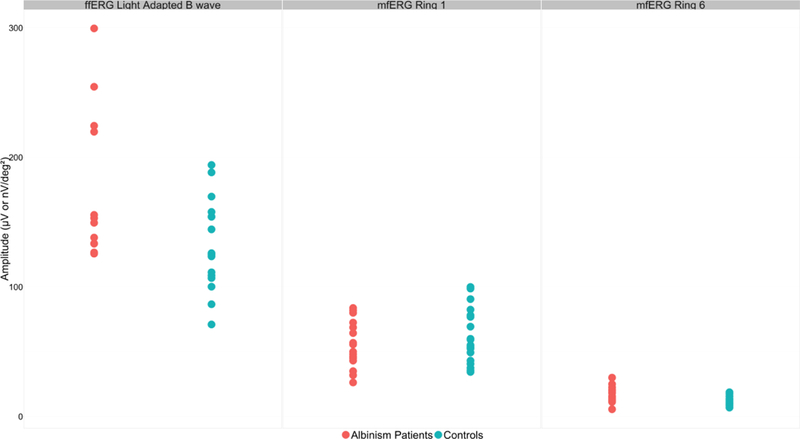
Fig.3. Full field and Multifocal ERG amplitudes for Ring 1 and Ring 6 in albinism patients vs controls.

This scatterplot depicts the amplitudes for patients (n=16) and controls (n=17 for ffERG, n=19 for mfERG) on ffERG light adapted b-wave in μV (left), mfERG Ring 1 (middle) and mfERG Ring 6 (right) in nV/deg2. Albinism patients averaged higher ffERG b-wave amplitudes than the controls (p<0.01), however there was considerable overlap between the groups. Albinism patients averaged lower mfERG amplitudes than controls in Ring 1, however it was not statistically significant. Albinism patients averaged higher mfERG amplitudes than the controls in Ring 6, and while there was overlap of values, the difference is statistically significant (p<0.01).
