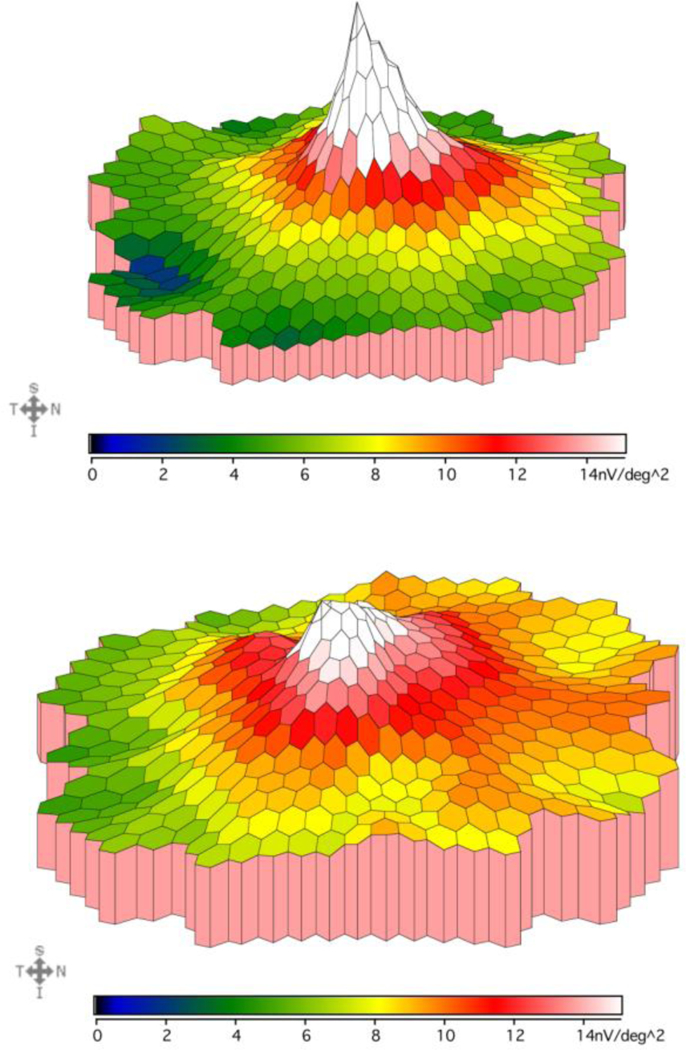
Fig.4. mfERG density plot comparison in a control and an albinism patient.

This figure compares the mfERG responses recorded from the macula in a control subject (top, age 12 years) vs an albinism patient (bottom, age 12 years). Color gradient corresponds to different mfERG amplitudes as shown below each density plot. This albinism patient demonstrates a slower drop off of amplitude from center to periphery and higher amplitudes than controls in the outermost rings, which is representative of the patient group.
