
Figure 1. Genome-wide Co-occupancy of Reprogramming Factors in AGHMT iCLMs.
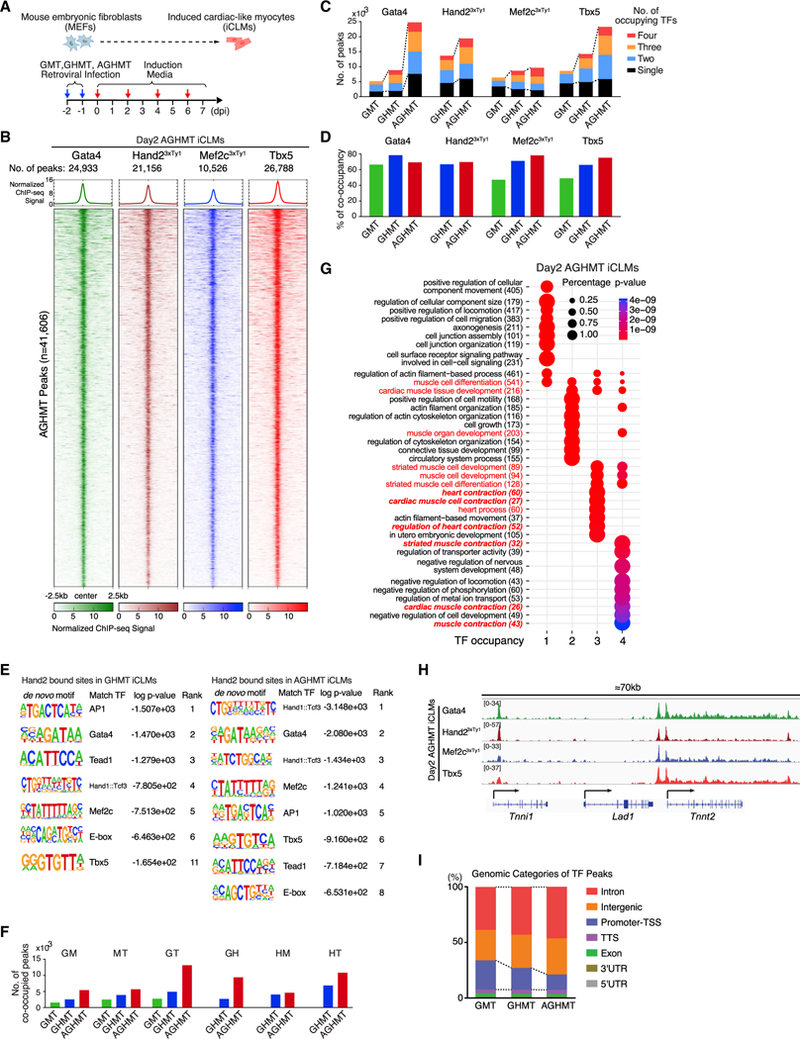
(A) Strategy for cardiac reprogramming in MEFs. (dpi, days post-induction.)
(B) ChIP-seq data for Gata4, Hand2, Mef2c, and Tbx5 display co-occupancy at 41,606 genomic binding sites in day 2 AGHMT iCLMs. ChIP-seq signal heatmap using a 5 kb window was centered on peak regions and sorted in descending order by signal intensity.
(C) Number of TF peaks of GMT, GHMT, and AGHMT in day 2 iCLMs.
(D) Percentage of TF peaks co-occupied by more than two TFs.
(E) De novo motifs identified at Hand2 bound sites in day 2 iCLMs by HOMER.
(F) Number of TF peaks with different pairs of TFs in day 2 iCLMs.
(G) TF peaks were annotated to the nearest neighboring genes, and GO enrichment analysis was performed with DAVID (v.6.8). GO enrichment from different groups based on the number of occupying TFs was performed with clusterProfiler (v.3.6.0).
(H) Genome browser view showing the co-occupancy of Gata4, Hand2, Mef2c, and Tbx5 in a 70 kb window encompassing Tnni1, Lad1, and Tnnt2 genes in day 2 iCLMs.
(I) GMT, GHMT, and AGHMT ChIP-seq peaks were classified into seven genomic categories. Dashed lines connect the group of intronic and intergenicTF peaks.
See also Figures S1 and S2 and Table S1.