
Figure 2. Synergistic Enhancer Activation during Reprogramming.
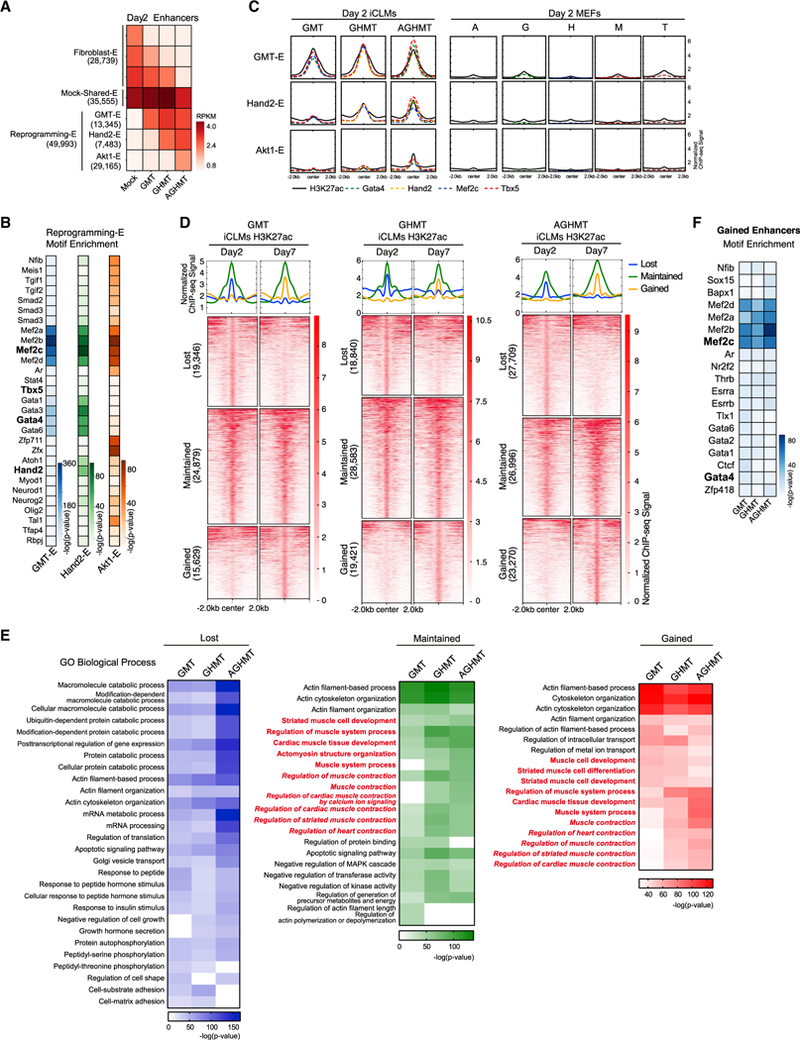
(A) H3K27ac enhancer peaks in day 2 iCLMs clustered into three groups (Fibroblast-Enhancer, Mock-Shared-Enhancer, and Reprogramming-Enhancer). Fibroblast-Enhancer and Reprogramming-Enhancer were then sub-clustered into groups depending on their response to GMT, GHMT, and AGHMT (GMT-E, Hand2-E, and Akt1-E for Reprogramming-E). Each box represents the mean RPKM H3K27ac enhancer signals of the group of enhancers.
(B) Heatmaps of known motifs enriched in GMT-E, Hand2-E, and Akt1-E peaks.
(C) Normalized ChIP-seq binding profiles for H3K27ac and TFs show similar distribution patterns on a genome-wide scale in iCLMs. TF peaks show higher correlation with Hand2-E and Akt1-E peaks in the presence of Hand2 and Akt1, respectively. Single-factor overexpressing MEFs show weak signals of H3K27ac and TF binding at the Reprogramming-E regions.
(D) Heatmaps of reprogramming enhancers clustered into three distinct groups depending on differences between day 2 and 7 iCLMs.
(E) Heatmaps of overrepresented terms belonging to the Biological Process GO in each enhancer cluster. Terms related to heart or muscle contraction are highlighted in red italics.
(F) Heatmap of known motifs enriched in enhancers gained by day 7 compared to day 2 iCLMs.