
Figure 3. Conservation of the Reprogramming Enhancer Landscape in Cardiogenic Processes.
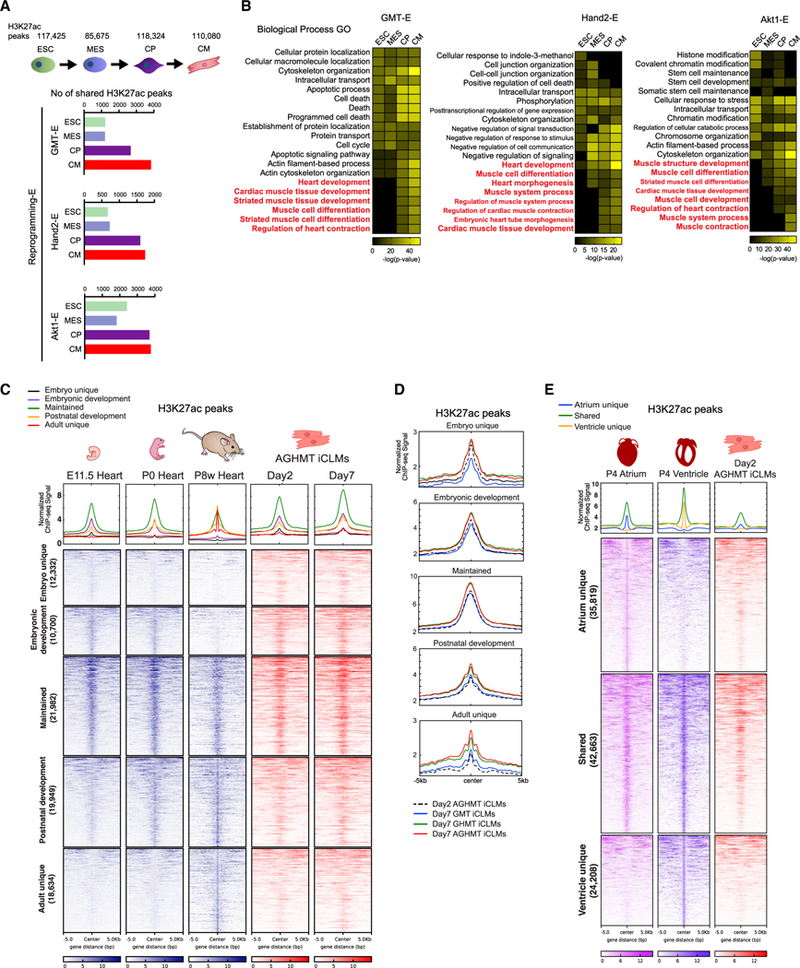
(A) Comparison of Reprogramming-E peaks with active enhancers in embryonic stem cells (ESC), mesoderm (MES), cardiac precursors (CP), and cardiomyocytes (CM).
(B) Heatmaps of overrepresented terms belonging to the Biological Process GO using GREAT in each reprogramming enhancer cluster.
(C) Heatmaps of H3K27ac enhancer ChIP-seq signals of E11.5, P0, and P8 week hearts from ENCODE datasets, and day 2 and 7 AGHMT iCLMs clustered according to their appearance in different developmental stages.
(D) Normalized ChIP-seq binding profiles for H3K27ac of day 2 AGHMT, and day 7 GMT, GHMT, and AGHMT iCLMs, in each developmental cluster from Figure 3C are shown.
(E) Heatmap of H3K27ac enhancer ChIP-seq signals of P4 atrium, ventricle, and day 2 AGHMT iCLMs using a 10 kb window, clustered according to their presence in P4 atrium and ventricle. Normalized ChIP-seq binding profiles for H3K27ac in each cluster are shown.