
Figure 4. In Vivo Cardiac Activity of Reprogramming Enhancers.
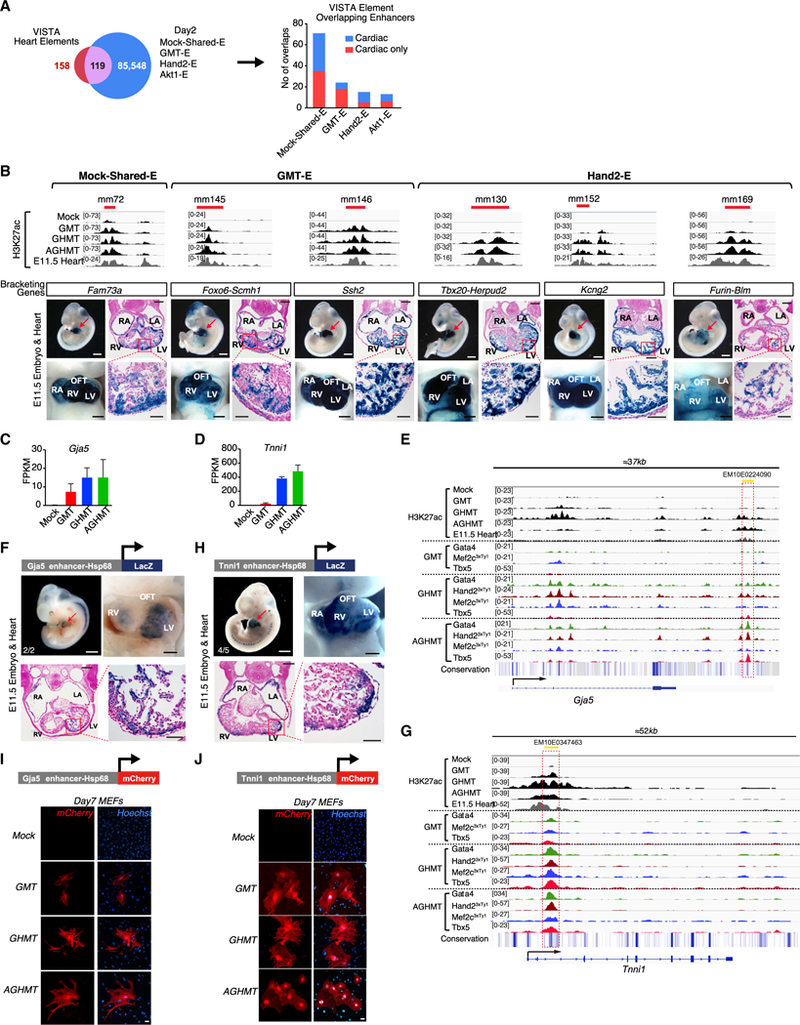
(A) iCLM enhancers (Mock-Shared-E + GMT-E + Hand2-E + Akt1-Efrom Figure 2A) were overlapped with 158 mouse heart enhancers from the VISTA enhancer database, which showed an overlap of 119 enhancers. Numbers of iCLM enhancers in different groups overlapping with the VISTA heart enhancers are shown. “Cardiac only” indicates enhancers that show exclusively cardiac activity and “Cardiac” indicates enhancers that show activity in the heart plus other tissues, based on the VISTA database.
(B) Top: H3K27ac enrichment profiles showing predicted enhancers. Red bars indicate respective VISTA enhancer elements. Bottom: subregional cardiac enhancer activities of six VISTA heart enhancers that overlap iCLM enhancers. Shown is a representative transgenic E11.5 embryo with LacZ reporter staining (blue) indicating enhancer activity. Red arrowhead indicates the heart and heart sections that were counter-stained with Nuclear Fast Red. (white scale bars: 1 mm; black scale bars: 500 μm for whole-mount heart and 200 and 50 μm for low- and high-magnification histology sections, respectively)
(C and D) mRNA expression of Gja5 (C) and Tnnil (D) is upregulated in day 2 iCLMs based on RNA-seq (n = 3 per group). Data are represented as mean ± SD.
(E) A highly conserved putative regulatory element ~25 kb downstream of the Gja5 locus (Gja5-E) that overlaps with an ENCODE based candidate Regulatory Element (EM10E0224090) is co-occupied by TFs during cardiac reprogramming. Conservation track was generated from Euarchontoglires subset of the UCSC genome browser.
(F) Schematic of Gja5 enhancer LacZ construct and a representative image of E11.5 transgenic embryo and heart stained with β-galactosidase showing LacZ expression in the heart. Numbers indicate embryos with cardiac expression over the total LacZ+ genotyped embryos (white scale bar: 1 mm; black scale bar: 500 mm). A section of the E11.5 transgenic heart was counter-stained with Nuclear Fast Red (black scale bars: 200 and 50 μm for low-and high-magnification histology sections, respectively).
(G) A highly conserved putative regulatory element in the Tnni1 intronic locus that overlaps with an ENCODE based candidate Regulatory Element (EM10E0347463) is co-occupied by TFs during cardiac reprogramming. The red dashed box indicates the region of the putative regulatory element.
(H) Schematic of Tnni1 enhancer LacZ construct and a representative image of E11.5 transgenic embryo and heart stained with β-galactosidase showing LacZ expression in the heart. Numbers indicate embryos with cardiac expression over the total LacZ+ genotyped embryos (white scale bar: 1 mm; black scale bar, 500 μm). A section of E11.5 transgenic heart was counter-stained with Nuclear Fast Red (Black scale bars, 200 and 50 μm for low- and high-magnification histology sections, respectively).
(I and J) Schematic of Gja5 (I) and Tnni1 (J) enhancer mCherry construct. Gja5-E- or Tnni1-E-Hsp68-mCherry was retrovirally delivered to MEFs together with the reprogramming factors. Representative image of day 7 mock-infected, GMT, GHMT, and AGHMT MEFs shows mCherry expression. (Bars, 50 μm.)
See also Figures S4 and S5, Table S4, and Table S5.