
Figure 7. Inhibition of EGFR Signaling Enhances Cardiac Reprogramming.
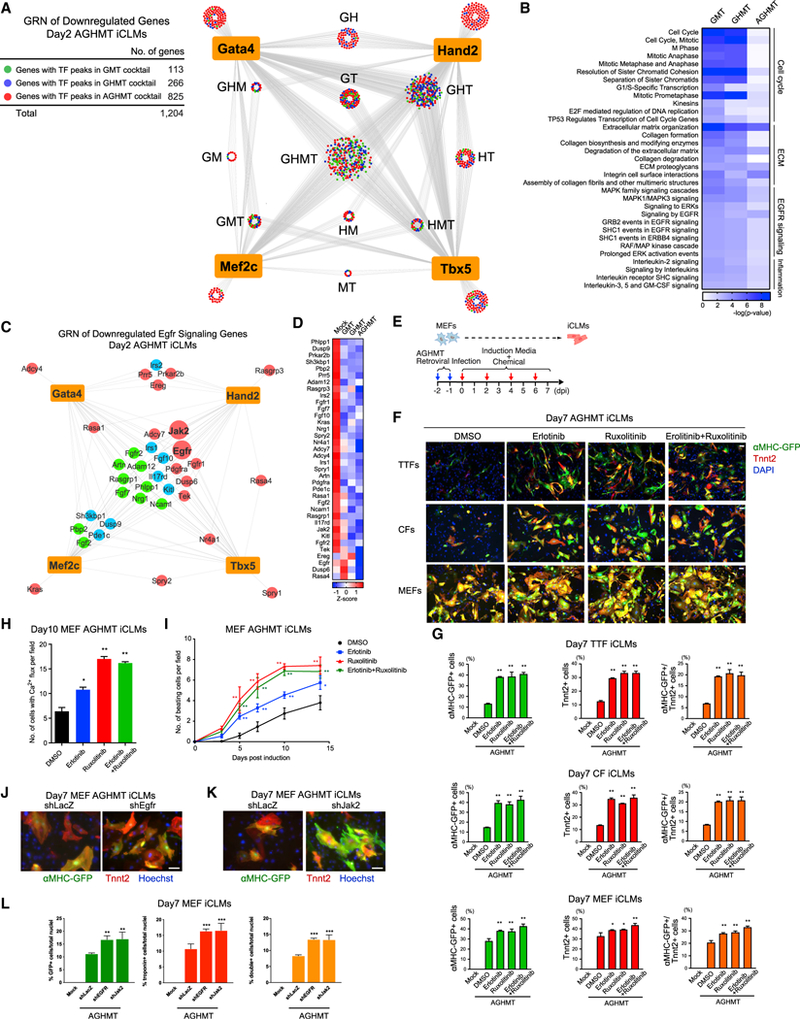
(A) GRN of reprogramming factors and downregulated genes in day 2 AGHMT iCLMs. Each node represents a gene and edges are drawn to all the annotated genes of reprogramming TF peaks.
(B) Genes colored in green (GMT), blue (Hand2), or red (Akt1) in (A) were used for GO analyses using PANTHER. Heatmap shows downregulated signaling pathways targeted by reprogramming factors.
(C) GRN of downregulated Egfr signaling pathway genes in day 2 AGHMT iCLMs.
(D) Gene expression heatmap of all genes from (C).
(E) Strategy for testing chemicals on iCLMs during reprogramming.
(F) Representative immunocytochemistry images of AGHMT reprogrammed fibroblasts from αMHC-GFP transgenic mice treated with DMSO or the indicated chemicals. Cells were fixed and stained for αMHC-GFP (green), Tnnt2 (red), and DAPI (blue) 7 days after infection. (Bars, 100 μm.)
(G) Quantification by flow cytometry of αMHC-GFP+ and Tnnt2+ iCLMs 7 days after treatment with AGHMT and DMSO or the indicated chemicals (n = 3, independent experiments). (*p < 0.05 versus AGHMT+DMSO, **p < 0.01 versus AGHMT+DMSO.) Data are represented as mean ± SD.
(H) Quantification of Ca2+ flux-positive MEFs after 10 days of reprogramming using Fluo-4 NW dye (n = 3, independent experiments). (*p < 0.05 versus AGHMT+DMSO, **p < 0.01 versus AGHMT+DMSO). Data are represented as mean ± SD.
(I) Quantification of spontaneous beating MEF iCLMs after treatment (n = 3, independent experiments). (*p < 0.05 versus AGHMT+DMSO, **p < 0.01 versus AGHMT+DMSO.) Data are represented as mean ± SD.
(J and K) Representative immunocytochemistry images of AGHMT iCLMs from αMHC-GFP transgenic mice treated with Egfr shRNA(J) or Jak2 shRNA(K). Cells were fixed and stained for αMHC-GFP (green), Tnnt2 (red), and Hoechst (blue) 7 days after infection. (Bars, 100 μm.)
(L) Quantification of αMHC-GFP+ and Tnnt2+ iCLMs 7 days after infection with AGHMT and the indicated shRNAs by immunocytochemistry (n = 3, independent experiments). (**p < 0.01 versus AGHMT+shLacZ, ***p < 0.0001 versus AGHMT+shLacZ.) Data are represented as mean ± SD.