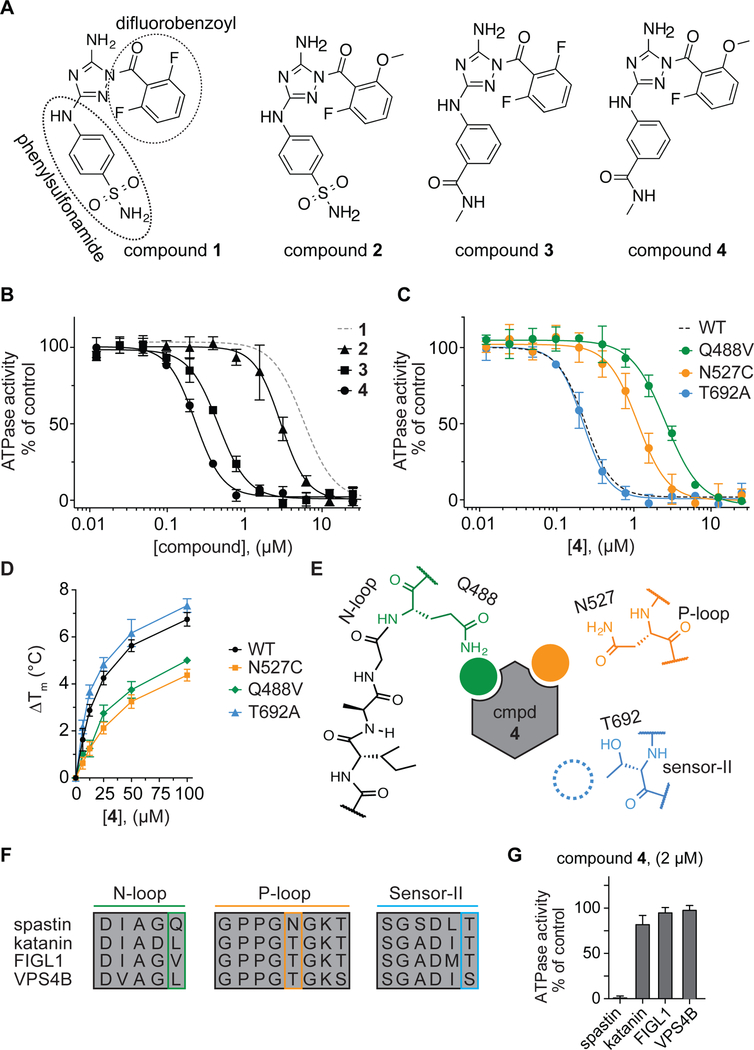
Figure 3. Using RADD to characterize binding of a potent diaminotriazole-based inhibitor to spastin.
(A) Chemical structures of compounds 1–4. (B) Compound concentration-dependent inhibition of the steady-state ATPase activity of spastin wild-type (WT). Graph shows average values ± s.d. (n = 3) fit to a sigmoidal dose-response equation. For comparison, the curve for compound 1 (data from Figure 1C) is also shown (gray dashed line). Compound 2: IC50 = 2.77 ± 0.39 µM; Compound 3: IC50 = 0.45 ± 0.03 µM; Compound 4: IC50 = 0.23 ± 0.02 µM (average ± s.d., n=3, 0.5 mM MgATP). (C) Compound 4 concentration-dependent inhibition of the steady-state ATPase activity of three spastin constructs with mutations at variability hot-spot residues (Q448V, N527C and T692A). Graph shows average values ± s.d. (n = 3) fit to a sigmoidal dose-response equation. For comparison, the corresponding curve for spastin-WT is shown (dashed line, data from Figure 3B). IC50 values: spastin-Q488V: 2.60 ± 0.15 µM; -N527C: 1.11 ± 0.21 µM and -T692A: 0.22 ± 0.04 µM; average ± s.d., n = 3, 0.5 mM MgATP. (d) Concentration-dependent effect of compound 4 on the heat-induced denaturation of spastin-AAA constructs analyzed by differential scanning fluorimetry. Observed ∆Tm: -WT ~6.7 °C; -N527C ~4.5 °C; - Q488V ~5.0 °C; -T692A ~7.2 °C, 100 µM compound 4, average values are shown, error bars denote range, n = 2. (E) Schematic for the expected compound 4 interactions with variability hotspot residues in the active site of spastin (filled circles, predicted interaction; dashed circle, predicted weak or no interaction). Variability hot-spot residues in three nucleotide-binding motifs are shown (N-loop, green; P-loop, orange; sensor-II, blue). (F) Sequence alignment of nucleotide-binding motifs (N-loop, P-loop and sensor-II) in four AAA proteins. Variability hot-spot residues are highlighted (green, orange and blue rectangles). (G) Percentage steady-state ATPase activity of four AAA proteins in the presence of compound 4 (2 µM, 0.5 mM MgATP, average values are shown, error bars denote range, n=2).

