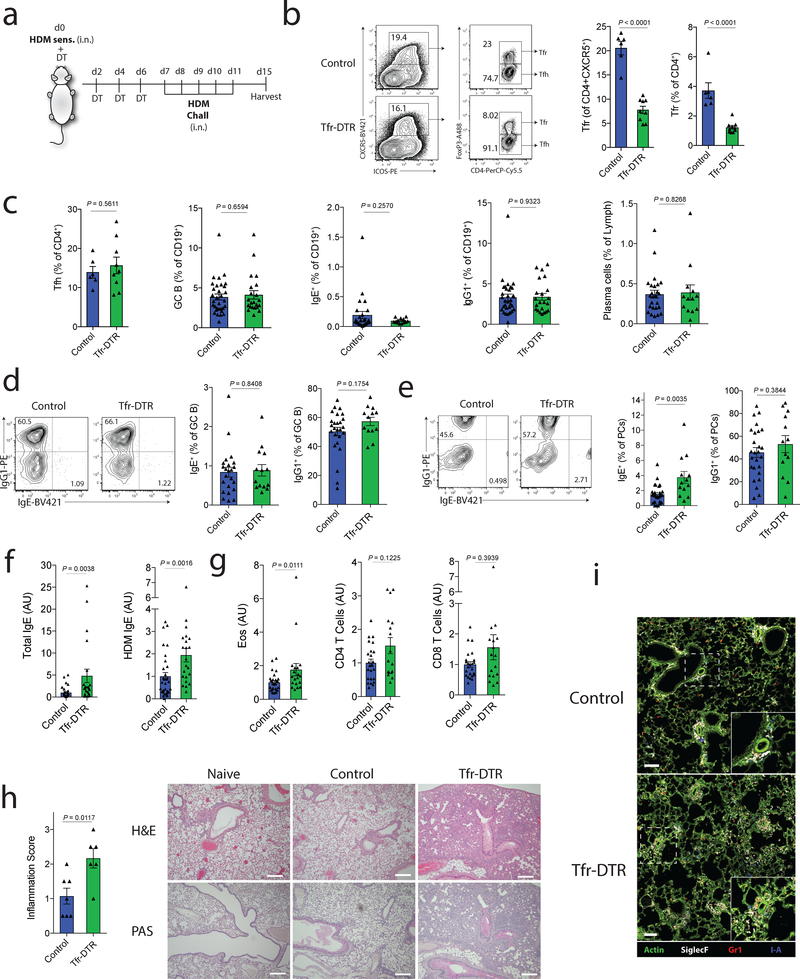
Figure 7. Tfr cells regulate HDM-specific IgE responses in vivo.
a) Schematic of HDM sensitization and challenge model to induce lung inflammation. Tfr-DTR (Foxp3Cre Cxcr5LoxStopLoxDTR/WT) or Control (Foxp3Cre Cxcr5WT/WT) mice received HDM sensitization at day 0 followed by DT administration at days 0,2,4 and 6. Mice were challenged with HDM on days 7–11 and harvested on day 15.
b) Analysis of Tfr cells from dLN of HDM challenged mice as in (a). Representative gating (left) and quantification (right) are shown.
c) Quantification of Tfh, GC B cells (CD19+GL7+FAS+), total IgE+ B cells (CD19+IgE+), total IgG1+ B cells (CD19+IgG1+) and total plasma cells (CD138+) from dLN of HDM challenged mice as in (a).
d) Quantification of IgG1 and IgE expression in GC B cells (CD19+GL7+FAS+).
e) Quantification of IgG1 and IgE expression in plasma cells (CD138+).
f) Quantification of total IgE or HDM-specific IgE from HDM challenged mice as in (a). (n=30, Control; n=22, Tfr-DTR)
g) Quantification of Eosinophils (left), CD4 T cells (middle) or CD8 T cells (right) from the BAL fluid of mice as in (a). (n=24, Control; n=17, Tfr-DTR)
h) Lung inflammation scores (left) and representative images of H&E or PAS staining (right) of lung samples. Scale bars = 500μM.
i) Immunofluorescence micrographs of lungs stained for Actin, SiglecF, Gr1 and I-A. Scale bars = 100μM.
Column graphs represent the mean with error bars indicating standard error. P value indicates two-tailed student’s T test (b-e) or Mann-Whitney (f-h).
Data are from individual experiments and are representative of 3 independent experiments (b, c left), are combined data from 4 independent experiments (c right, d-g), or are from one experiment (h-i).

