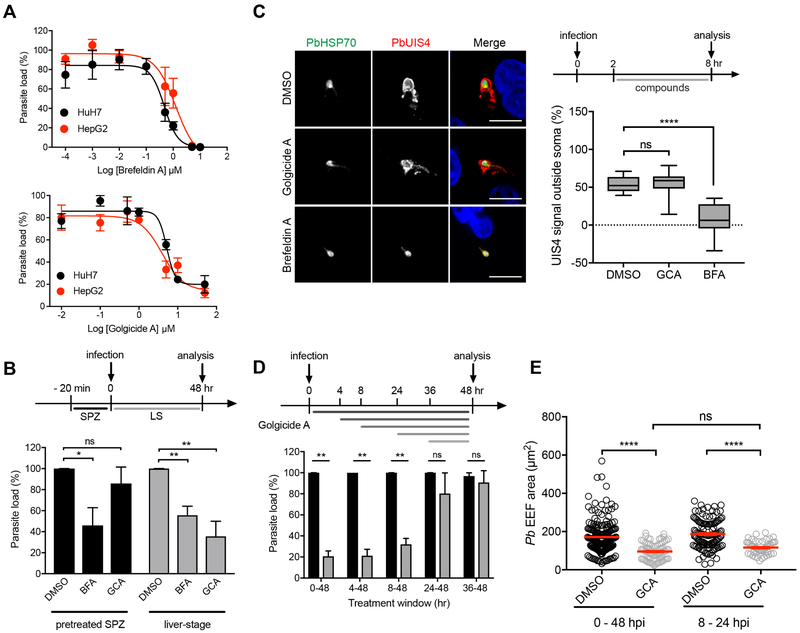
Figure 3. Pharmacological Evaluation of Protein Trafficking Inhibition on Liver-Stage Parasite Load.
(A) Dose-response curves for brefeldin A and golgicide A in P. berghei- infected HepG2 (red) and Huh7 (black) cells. Data are mean ± SEM; n = 3-4 biological replicates.
(B) Schematic illustration of the experimental setup (top panel). P. berghei-Luc sporozoites were pretreated with DMSO (vehicle control), 0.5 μM of brefeldin A (BFA) or 3.5 μM of golgicide A (GCA) for 20 minutes at room temperature. Following pretreatment, sporozoites were used to infect HepG2 cells (pretreated SPZ, bottom panel). In parallel, BFA and GCA were added to cells immediately prior to infection (liver-stage, bottom panel). Parasite load was measured at 48 hpi. Data were normalized to the DMSO control and shown as mean ± SEM; n = 4 biological replicates. *P < 0.05, **P < 0.01; ns, non-significant (Student’s t-test).
(C) Effects of golgicide A and brefeldin A on PbUIS4 trafficking to the PVM during early liver-stage schizogony. Representative confocal images of DMSO- (vehicle control), golgicide A-,and brefeldin A-treated Huh7 cells infected with P. berghei sporozoites and fixed at 48 h post-infection. Cells were stained with anti-PbUIS4 (red), anti-PbHSP70 (green), and DAPI (blue) (left). Schematic illustrating the experimental setup (top right). Quantification of the proportion of PbUIS4 positive pixels not overlapping with PbHSP70 pixels in each condition (n = 11-12) (bottom right). ****P < 0.0001 (one-way ANOVA, Dunnett’s multiple comparison test). Scale bars, 10 μm.
(D) Schematic illustration of the experimental setup (top panel). Time-course analysis of golgicide A treatment (3.5 μM) on liver-stage Plasmodium. GCA was added to HepG2 cells infected with P. berghei-Luc sporozoites at 0, 4, 8, 24 or 36 h post-infection. Parasite load was measured at 48 h post-infection. Data are mean ± SEM normalized to corresponding control condition (DMSO, vehicle) for each time point; n=3 biological replicates. **P < 0.01; ns, non-significant (Student’s t-test).
(E) P. berghei-infected HepG2 cells were treated with DMSO (vehicle control) or 3.5 μM golgicide A from 0-48 hpi (DMSO, n = 176; GCA, n = 82) or 8-24 hpi (DMSO, n = 119; GCA, n = 49) and fixed at 48 h post-infection. Cells were stained with anti-PbUIS4, a PVM resident protein, to enable quantification of parasite size by microscopy. Data are mean ± SEM (red line). ****P < 0.0001; ns, non-significant (Kruskal-Wallis test).

