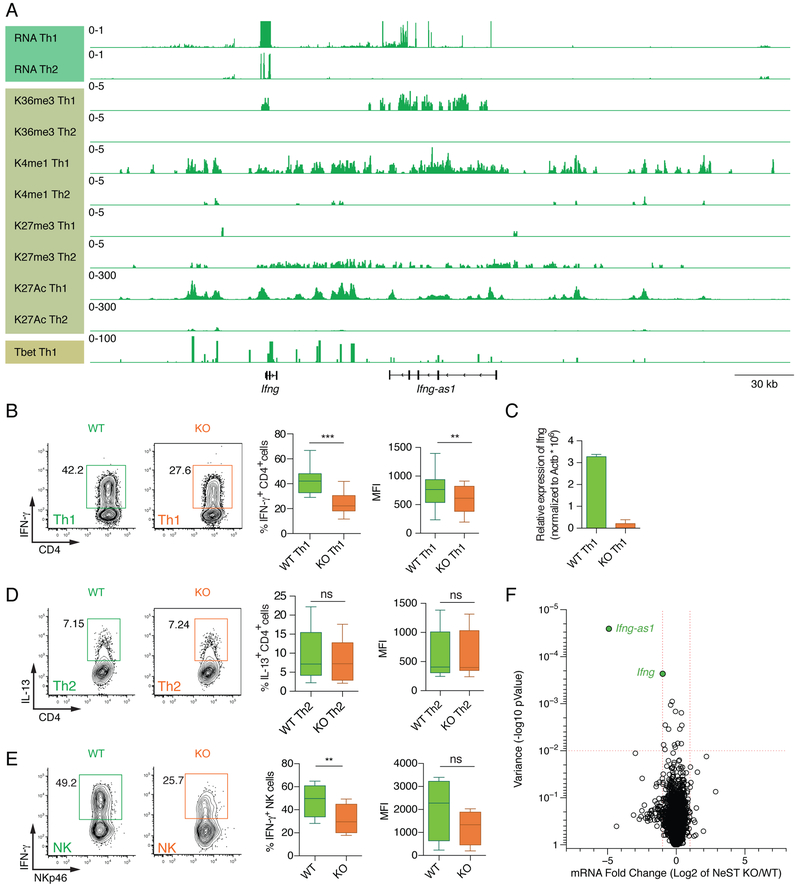
Figure 1: Reduced Ifng expression in Ifng-as1 KO Th1 cells and Ifng-as1 KO NK cells.
(A) Genome track view of the Ifng locus showing RNA sequencing, H3K36 trimethylation, H3K4 monomethylation, H3K27 trimethylation, H3K27 acetylation for WT Th1 and Th2 cells and Tbet binding for Th1 cells. (B)-(D) Naïve T cells from WT mice or Ifng-as1 KO mice were isolated by FACS and cultured under Th1 (B)(C) or Th2 (D) polarization conditions for up to 8 days. (B) IFN-γ expression was analyzed by flow cytometry on day 6 of Th1 culture. Shown are representative flow cytometry plots and cumulative data from n=12 independent experiments. (C) Ifng expression on day 6 of Th1 culture was analyzed by RT-qPCR and normalized to the expression of β-actin. (D) IL-13 expression was analyzed by flow cytometry at day 6 of Th2 culture. Shown are representative flow cytometry plots and cumulative data from n=12 independent experiments. (E) Splenocytes from WT mice or Ifng-as1 KO mice were isolated and cultured in the presence of IL-12 and IL-2 for 6 hours. IFN- γ expression in NKp46+ NK cells was measured by flow cytometry. Shown are representative flow cytometry plots and cumulative data from n=4 independent experiments. (F) Volcano plot showing log2 fold changes in RNA expression between WT and Ifng-as1 KO Th1 cells (d6 of culture) and their associated p-values. A gene was identified as significantly changed (green dots) if the log2 fold change was greater than 2 and the p-value less than 0.01. Box plots in (B), (D), and (E) show minimum, median and maximum. Graph in (C) shows mean ± sem. *p<0.05 **p<0.01 ***p<0.001. See also Figure S1 and S2.

