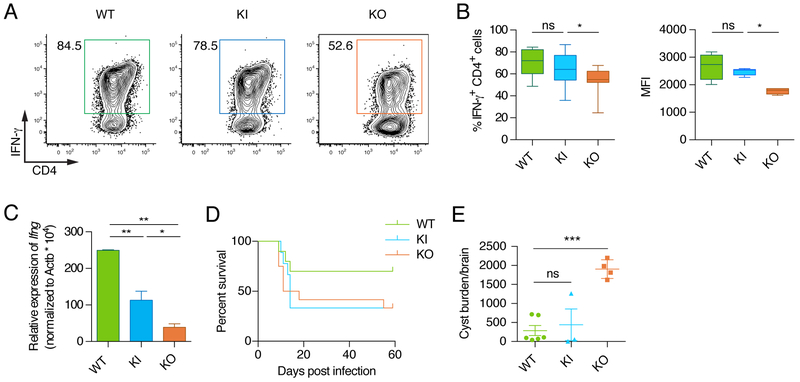
Figure 3: Absence of Ifng-as1 RNA leads to small reduction in Ifng expression and impaired survival during Toxoplasma gondii infection.
(A-C) Naïve T cells from WT mice, Ifng-as1 KO, and Ifng-as1-PolyA KI mice were isolated by FACS and cultured under Th1 or Th2 polarization conditions for 6 days. (A)(B) IFN-γ was analyzed by flow cytometry. Shown are representative flow cytometry plots and cumulative data from n=8 independent experiments. (C) Ifng expression was analyzed by RT-qPCR and normalized to the expression of β-actin. (D) WT mice, Ifng-as1 KO mice, and Ifng-as1-PolyA KI mice were infected with 25 cysts of T. gondii (ME49 strain) and monitored for survival. (E) On day 60 of T. gondii infection the number of cysts per brain was counted. Shown are pooled data from n=2 independent experiments. Box plots in (B) show minimum, median and maximum. Graphs in (C) and (E) show mean ± sem. *p<0.05 **p<0.01 ***p<0.001. See also Figure S4 and S5.

