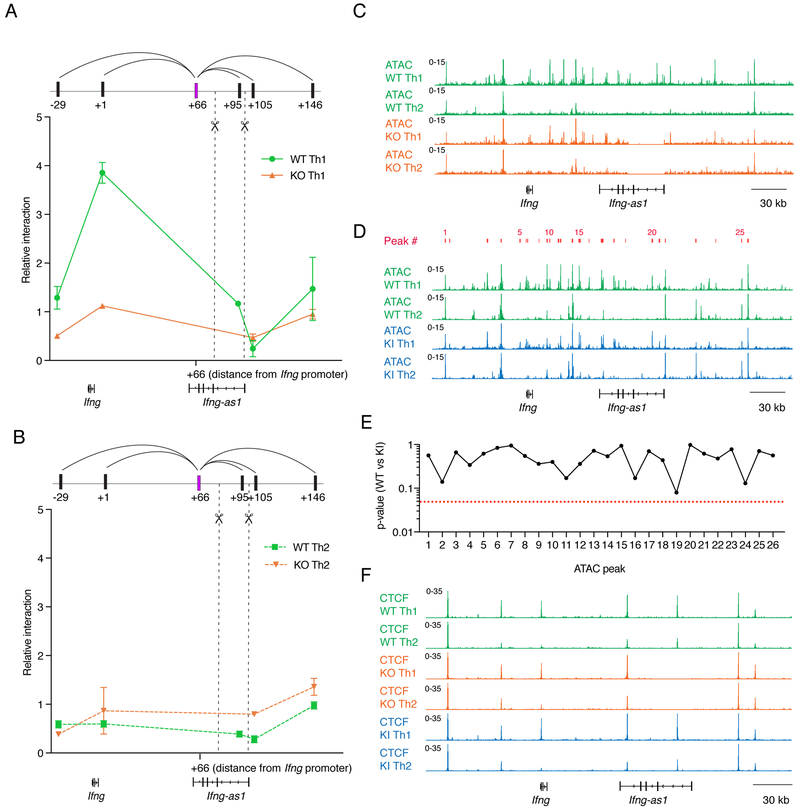
Figure 5: Extent of local chromatin interactions does not depend on locus accessibility and CTCF binding at the extended Ifng/Ifng-as1 loci.
(A)(B) Looping interactions within the Ifng/Ifng-as1 loci were analyzed by 3C between the +66 kb (66 kb downstream of Ifng TSS) HindIII fragment as anchor (shown in violet) and different fragments positioned at increasing distances from the anchor. Shown are representative data from n=3 independent experiments using Th1 cells (A) or Th2 cells (B). Dashed lines indicate deleted DNA fragment in Ifng-as1 KO cells. (C) ATAC sequencing profiles comparing WT and Ifng-as1 KO Th1 and Th2 cells. Shown are representative tracks from n=2 independent experiments (D) ATAC sequencing profiles for WT and Ifng-as1-PolyA KI Th1 and Th2 cells. Shown are representative tracks from n=2 independent experiments. 26 ATAC peaks (indicated in red) were called in a 340 kb region encompassing Ifng and Ifng-as1. (E) Statistical significance (p-values) of peak calling between WT and Ifng-as1-PolyA KI Th1 ATAC sequencing samples (F) Genomic tracks of CTCF binding comparing Th1 and Th2 cells (day 6 of culture) isolated from WT and Ifng-as1 KO mice and Ifng-as1-PolyA KI mice. Shown are representative tracks from n=2 independent experiments. See also Table T1.

