
Figure 1.
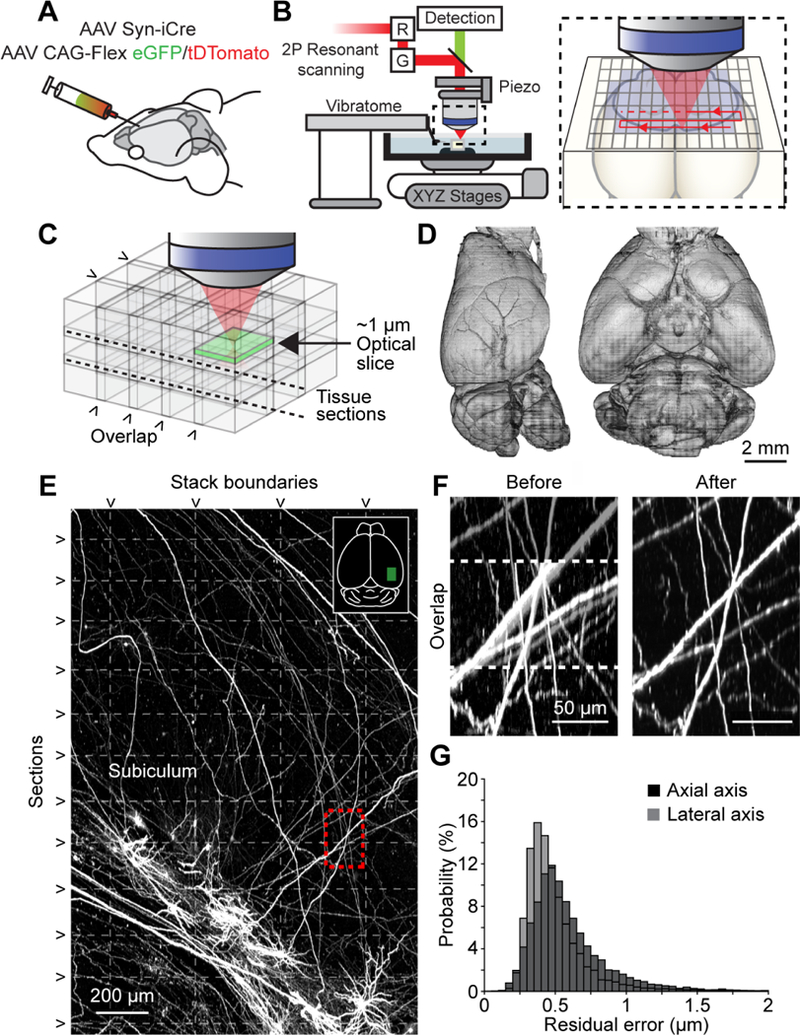
Imaging pipeline. (A) Animals were injected in targeted brain areas with a combination of a low-titer AAV Syn-iCre and a high-titer AAV CAG-Flex-(eGFP/tDTomato). (B) Two-photon microscope with an integrated vibratome. Inset, sequential imaging of partially overlapping image stacks. (C) Image stacks overlapped in x, y, and z. (D) Rendered brain volume after stitching (sample 2016–10-31 in Table S2). (E) Horizontal maximum intensity projection through a 1300 × 2000 × 600 μm3 volume of the motor cortex containing labeled somata and neurites. Horizontal dashed lines mark physical tissue sections; vertical dashed line represents stack boundaries. Dashed box is region shown in F. (F) Example of boundary region between two adjacent image stacks before (left) and after stitching (right). Dashed line indicates overlap region. (G) Residual stitching error in the lateral and axial directions. See also Table S1, S2, Figure S1, and Movie S1.