
Figure 2.
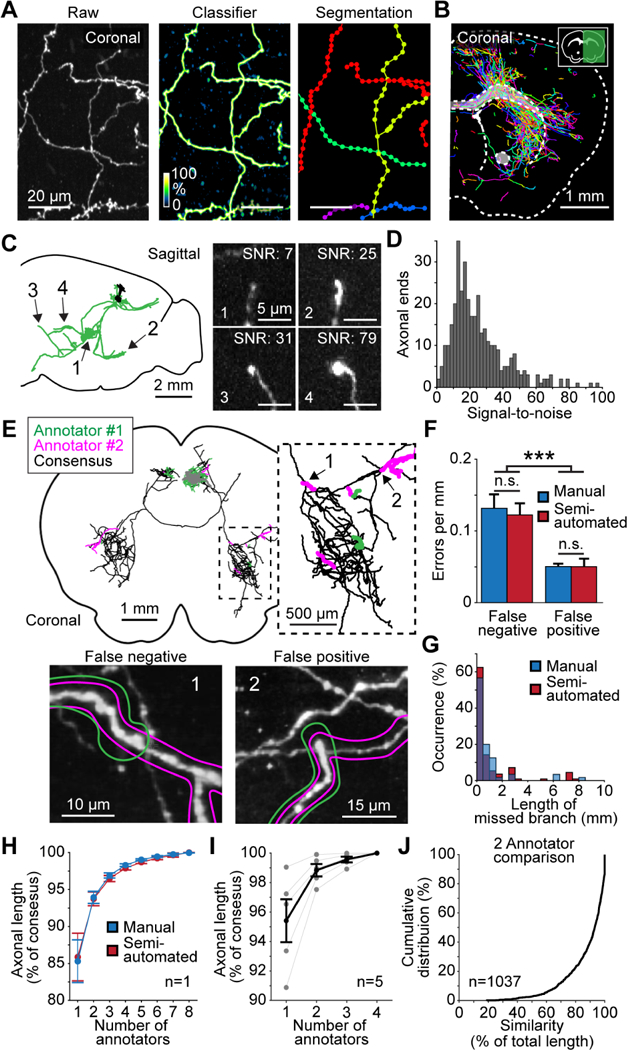
Complete semi-automated reconstruction of individual neurons. (A) Automated segmentation. Left, raw maximum intensity image of axons in the thalamus. Middle, probability map output from classifier. Right, segmentation result, with each detected segment depicted in a different color. (B) Coronal section through a sample with overlaid segmented neurites. (C) Left, sagittal view of a reconstructed cortical neuron. Arrows indicate location of axon endings shown on the right. Right, maximum projection of axon endings several millimeters away from the soma (1: 4.1 mm; 2: 4.9 mm; 3: 6.5 mm; 4: 4.6 mm). Numbers in top right show individual signal-to-noise ratios. (D) Distribution of image signal-to-noise ratio for axon endings (difference in intensity between the axon ending and surrounding background, divided by the standard deviation of background). (E) Establishing consensus in reconstructions produced by two annotators. Top, example reconstruction of a single neuron. Black, agreement between two annotators; green and magenta, unique segments detected by one of the two annotators. Inset, higher magnification view of dashed box on the left. Bottom, images of the areas of confusion numbered in the inset shown above. Colored outlines represent the reconstructions of the two annotators. (1) False-negative error, or a missed branch. (2) False-positive error consisting of an erroneously appended branch. (F) Frequency of each error-type for manual and semiautomated reconstructions. (G) Length distribution of missed neuronal branches for manual and semi-automated reconstructions. (H) Increase in accuracy as a function of the number of annotators reaching consensus. Accuracy is the proportion of axonal length that was correctly reconstructed. The consensus reconstruction from all eight annotators was defined as 100% accurate. (I) Same analysis as shown in H for 5 neurons across the brain with reconstructions from 4 annotators. (J) Cumulative distribution of reconstruction similarity between two annotators. Similarity is the proportion of axonal length present in the reconstructions of both annotators. Error bars ± SEM. ***: p < 0.001. See also Figure S2, S3, and Movie S2.