
Figure 3.
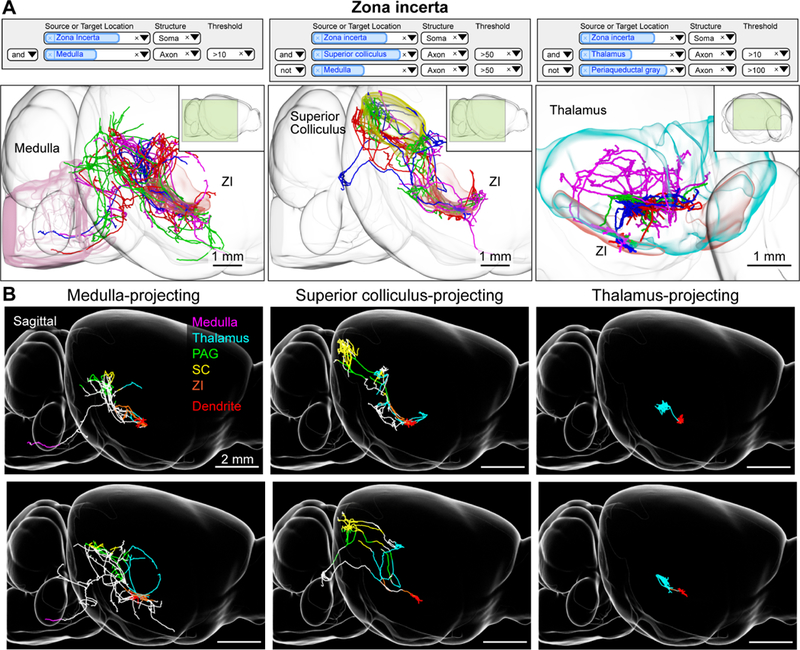
Zona incerta neurons. (A) Example queries (top) and 3d visualizations (bottom) for three projection groups in the zona incerta (ZI). Left, ZI neurons with axonal projections in the medulla. Middle, ZI neurons with projections in the superior colliculus but not the medulla. Right, ZI neurons with projections in the thalamus and not the periaqueductal gray. Inset shows perspective of shown area relative to the entire brain. (B) Examples of single ZI neurons belonging to the projection groups shown in A. Axons are color coded according to anatomical position (PAG: periaqueductal gray, SC: superior colliculus, ZI: zona incerta). Dendrites are shown in red. See also Figure S4 and movie S3.