
Figure 6.
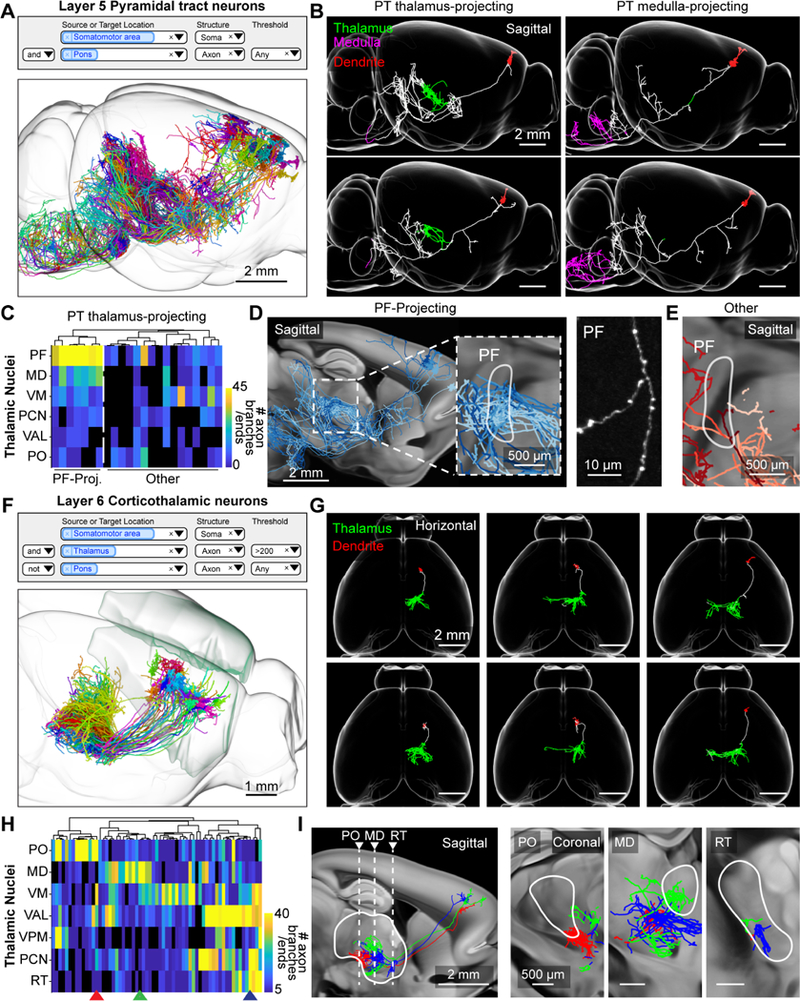
Thalamus-projecting neurons in the motor cortex. (A) Search query (top) and 3d visualization (bottom) for pyramidal tract (PT) neurons in the motor cortex with axons in the pons. (B) Sagittal view of single PT neurons that project to the thalamus (PT thalamus- projecting; green) or medulla (PT medulla-projecting; magenta) respectively. (C) PT neuron projections to different nuclei of the thalamus. Rows represent thalamic nuclei (PF: parafascicular nucleus, MD: mediodorsal nucleus, VM: ventral medial nucleus, PCN: paracentral nucleus, VAL: ventral anterior-lateral complex, PO: posterior complex). Columns correspond to individual neurons. The color of the heat map denotes the total number of axonal ends and branch points. The dashed white line separates neurons with dense innervation of the PF (PF-projecting) and those without (Other). (D) Left, sagittal view of PF-projecting neurons in shades of blue. Right, example image of axon in PF with varicosities. (E) Same area as in D, with PT thalamus-projecting neurons that do not project to PF in shades of red. (F) Search query (top) and 3d visualization (bottom) of layer 6 CT (L6-CT) neurons in the motor cortex. Neurons are identified by the presence of axons in the thalamus and the lack of projections to the pons. (G) Horizontal view of single L6-CT neurons and their axonal projections to the thalamus (green). Dendrites are red. (H) L6-CT neuron projections to thalamus. Rows, thalamic nuclei (PO: posterior complex, MD: mediodorsal nucleus, VM: ventral medial nucleus of the thalamus, VAL: ventral anterior-lateral complex of the thalamus, VPM: ventral posteromedial nucleus of the thalamus, PCN: paracentral nucleus, RT: reticular nucleus); columns represent individual neurons. The color of the heat map indicates the number of axon branches and ends. (I) Thalamic projections of example neurons (arrowheads in H). Left, dashed lines indicate the coronal views on the right. Greyscale images are from the Allen anatomical template. See also Figure S7 and Movie S4.