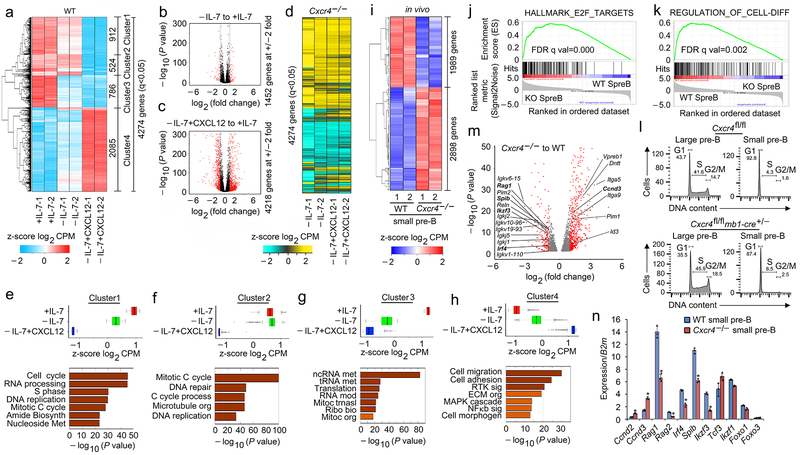
Figure 4. Pre-B cell differentiation is directly regulated by CXCR4 signaling.
a, Hierarchical clustering of differentially regulated genes (RNA-Seq) identified at q<0.05 in WT pre-B cells (replicates shown), cultured for 48 hrs with 16ng/ml of IL-7 (+IL-7) or 0.2ng/ml of IL-7 (−IL-7) or 0.2ng/ml of IL-7 with 100ng/ml of CXCL12 (−IL-7+CXCL12) without stromal cells. b, c, Volcano plots of differential expression of genes in WT pre-B cells cultured with or without IL-7 (b) or −IL-7+CXCL12 versus −IL-7 (c) (n=2 RNA-seq; FDR<0.01). Red dots are genes with significantly increased (right side) or decreased (left side) expression. −log 10 of the P values from Kal’s statistical test. d. Heat map of same genes in same order shown in (a) from RNA-Seq of Cxcr4−/− pre-B cells (replicates shown), cultured as indicated. e-h, Average expression of all differentially expressed genes in Cluster 1 (e), Cluster 2 (f), Cluster 3 (g) and Cluster 4 (h) of WT pre-B cells in +IL-7 or −IL-7 or −IL-7+CXCL12 culture conditions and corresponding gene ontology analysis. Only terms with FDR <5%, P<0.05 and over log2 2 fold enrichment were reported. Gene expression for individual RNA-seq replicates were averaged and the z-scores are plotted. Box represents interquartile range (IQR; Q1 -Q3 percentile) with black horizontal line representing the median. Maximum and Minimum are defined as Q3+1.5*IQR and Q1-1.5*IQR respectively. Outliers are indicated as black dots along the whiskers. −log 10 of the P values are from Kal’s statistical test. i, Heat map of RNA-Seq with clustering of upregulated and downregulated genes in flow-purified Cxcr4fl/fl-mb1-cre+/− (Cxcr4−/−) and WT small pre-B cells (q<0.05, replicates shown). j, k, Gene set enrichment analysis (GSEA) of ‘HALLMARK_E2F_TARGETS’ (j) and ‘REGULATION_OF_CELL_DIFFERENTIATION’. GSEA reports q-values based on the median of the p-value distribution. (k) pathways enriched in Cxcr4−/− (KO) small pre-B cells compared to WT small pre-B cells. l, Cell cycle analysis of flow purified large and small pre-B cells from Cxcr4fl/fl and Cxcr4fl/fl-mb1-cre+/− (Cxcr4−/−) mice (n=2). m, Volcano plot of differentially expressed genes in Cxcr4−/− versus WT small pre-B cells. Red dots are genes with significantly increased (right side) or decreased (left side) expression in Cxcr4−/− small pre-B cells compared to WT (FDR<0.01). −log 10 of the P values are from Kal’s statistical test. n, Quantitative real time PCR analyses of the expression of Ccnd2, Ccnd3, Rag1, Rag2, Irf4, Spib, Ikzf3 (encodes AIOLOS), Tcf3 (encodes E2A), Ikzf1 (encodes IKAROS), Foxo1 and Foxo3 in flow purified WT and Cxcr4−/− small pre-B cells (n=3). Data presented as average ± SD. P values were determined by unpaired t-test. (*P<0.001 compared to expression in WT small pre-B cells). (Primers and probes are presented in Supplementary Table 1)

