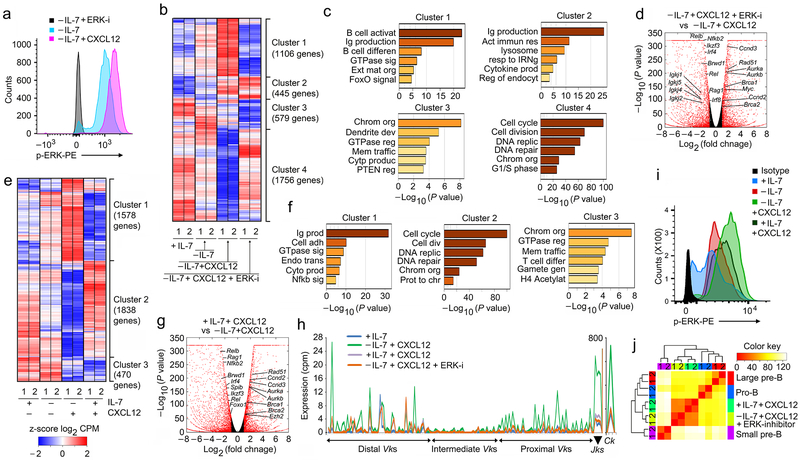
Figure 8. ERK signaling downstream of CXCR4 enables pre-B cell differentiation.
a, Flow-cytometry for intracellular phosphorylated ERK (p-ERK) in WT pre-B cells cultured as indicated. Negative control is -IL-7 cultured cells in presence of ERK inhibitor. Data is representative of three independent experiments. b, Hierarchical clustering of differentially regulated genes (RNA-Seq) identified both in vitro and in vivo at q<0.05 in WT pre-B cells (replicates shown), cultured as indicated. c, Gene ontology analysis of clusters identified in ‘b’. d, Volcano plot of differentially expressed genes in WT pre-B cells cultured as indicated. Red points mark genes with significantly increased (right side) or decreased (left side) expression in WT pre-B cells cultured −IL-7+CXCL12+ERK-I compared to −IL-7+CXCL12 (FDR<0.01). (n=2 RNA-seq; FDR<0.01). Red dots are genes with significantly increased (right side) or decreased (left side) expression. −log 10 of the P values from Kal’s statistical test. e, Hierarchical clustering of differentially regulated genes (RNA-Seq) identified in both in vitro and in vivo at q<0.05 in WT pre-B cells (replicates shown), cultured as indicated. f, Geneontology analysis of clusters identified in ‘e’. g, Volcano plot of differentially expressed genes in WT pre-B cells cultured in +IL-7+CXCL12 versus −IL-7+CXCL12 (FDR<0.01). (n=2 RNA-seq; FDR<0.01). Red dots are genes with significantly increased (right side) or decreased (left side) expression. −log 10 of the P values from Kal’s statistical test. h, Expression (RNA-Seq) of all Vks, Jks and Ck genes in WT pre-B cells cultured as indicated (n=2). i, Flow cytometry for intracellular p-ERK in WT pre-B cells cultured at +IL-7, −IL-7, +IL-7+CXCL12 and −IL-7+CXCL12+ERK-inhibitor conditions as indicated. Data is representative of three independent experiments. j, Comparison of differential transcriptional programs regulated by CXCR4 signals in WT pro-B, large pre-B and small pre-B cell progenitors and in vitro pre-B cells cultured in the presence or absence of IL-7 with CXCl12, and with or without ERK inhibitor. Hierarchical clustering of z-scored Log2 normalized expression levels, using a Euclidian correlation distance metric. The clustering dendrogram was plotted against the distance matrix for all indicated samples.

