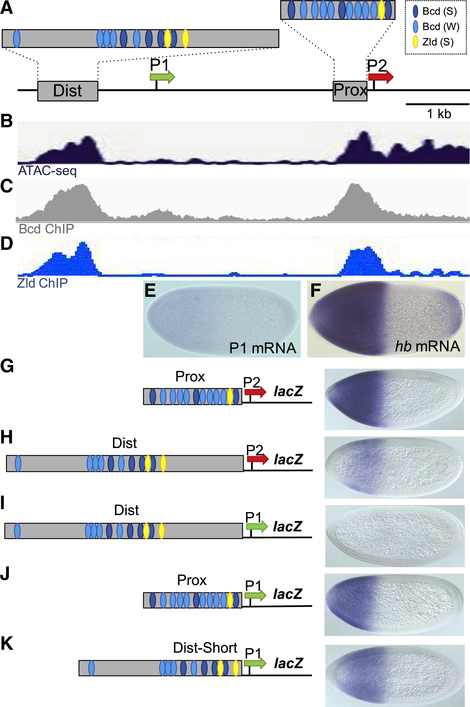
Figure 1. Testing Intrinsic Enhancer-Promoter Compatibilities at hb.
(A) Schematic of a 5.6 kb fragment from the hb locus showing two Bcd-dependent enhancers (gray boxes labeled Dist and Prox), approximate positions of Bcd and Zld binding sites in the two enhancers, and the P1 and P2 basal promoters (shown as green and red arrows, respectively). These conventions are used throughout this paper. See Data S1 for a detailed annotation of the hb locus.
(B) Read profiles of ATAC sequencing (ATAC-seq) in embryos at 18 min into NC13 (Blythe and Wieschaus, 2016).
(C) Binding profile of Bcd in NC9–NC14 embryos at the hb locus (Xu et al., 2014).
(D) Binding profile of Zld in NC13–NC14 embryos (Nien et al., 2011; Sun et al., 2015).
(E and F) Expression patterns of P1 transcripts (E) and hb transcripts (F) early in NC14.
(G–K) lacZ expression patterns driven by five enhancer-promoter combinations.
All embryos in this paper are oriented with anterior to the left and dorsal up.

