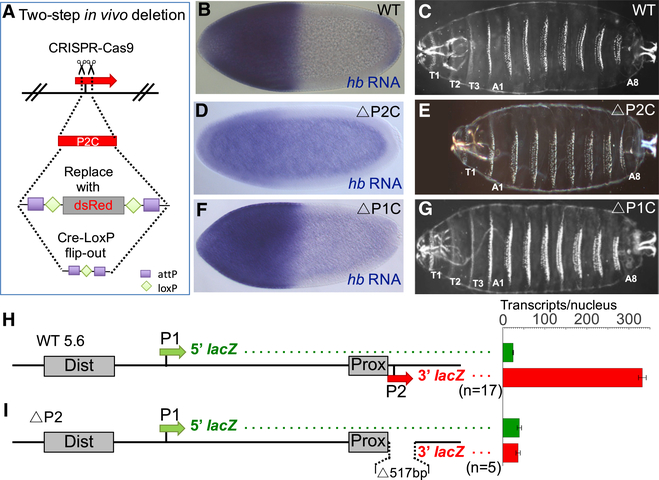
Figure 2. Testing Whether Deletion of P2 Causes the Activation of P1.
(A) Schematic of the two-step strategy for CRISPR/Cas9-based deletion of P2 core (P2C) sequences. (B–G) Analysis of mutant hb alleles carrying P2 and P1 deletions (for precise breakpoint sequences, see Table S1). Expression patterns of hb mRNA are shown for a wild-type embryo (B), a ΔP2C homozygote (D), and a ΔP1C homozygote (F). hb mRNA levels are also quantified in Figure S1. Cuticle preparations of first instar larvae (C, E, and G) are shown to the right. Each cuticle image is a merged composite of photographs of the anterior and posterior regions of a single larva. Thoracic segments (T1–T3) are labeled when present.
(H and I) Analysis of a wild-type dual reporter gene (H) and an identical reporter containing a 517 bp deletion of the P2 promoter (I). See STAR Methods, Figures S2 and S3, Table S2, and Data S2. Schematics of reporter genes are shown on the left and individually labeled.
All reporter genes in this paper contain the 5′ and 3′ halves of the lacZ transcription unit cloned immediately downstream of the P1 and P2 basal promoters, respectively. Green and red bars on the right represent levels of 5′ and 3′ lacZ transcripts, respectively, driven by each construct. The levels are shown as number of transcripts per nucleus (see STAR Methods). Error bars represent SEM. The number of embryos measured for each construct is shown below each reporter schematic.

