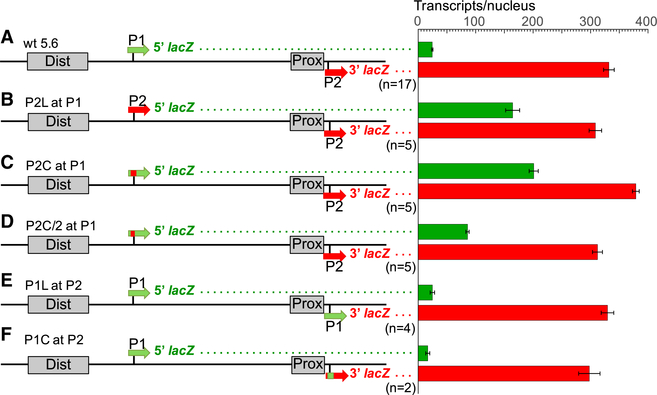
Figure 3. Mapping Sequences Required and Sufficient for Bcd-Dependent Activation.
(A F) Analysis of a wild type dual reporter gene (A) and identical reporter genes containing replacements of P1 sequences with P2 sequences (B, C, and D), and vice versa (E and F). Reporter gene schematics are shown on the left and individually labeled (see also Table S2). P2L and P1L refer to long promoter fragments (~500 bp), while P2C and P1C refer to core (120 bp) promoter fragments. Green and red bars on the right represent levels of 5′ and 3′ lacZ transcripts (number per nucleus), respectively, driven by each construct. Error bars represent SEM. The number of embryos measured for each construct is shown below each reporter schematic.

