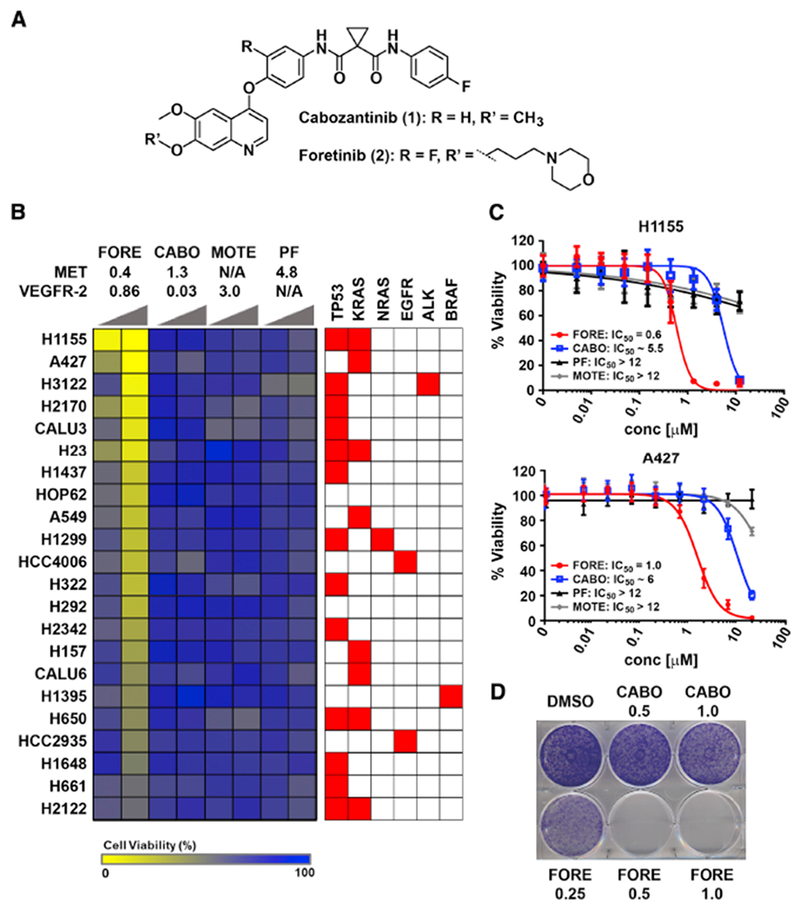
Figure 1. Foretinib displays non-canonical anticancer activity in NSCLC cells.

(A) Chemical structures of cabozantinib and foretinib.
(B) Viability-based cellular drug screening after 72 hours of treatment with foretinib (FORE), cabozantinib (CABO), motesanib (MOTE) and PF-04217903 (PF) in a total of 22 NSCLC cells with different genetic background. Displayed above the heatmap are the IC50 or Ki values (in nM) for MET and VEGFR-2 inhibition. Increasing wedges indicate concentrations of 0.5 μM and 2.5 μM. N/A: not applicable.
(C) Dose response curves of FORE, CABO, PF and MOTE for inhibition of viability of H1155 and A427 cells after 72 hours treatment and the respective IC50 values [μM], n = 3, Data are represented as mean ± SD.
(D) Representative clonogenic assay in A427 cells. Cells were treated with the indicated doses of FORE and CABO for 10 days. Data is representative of three independent experiments.
