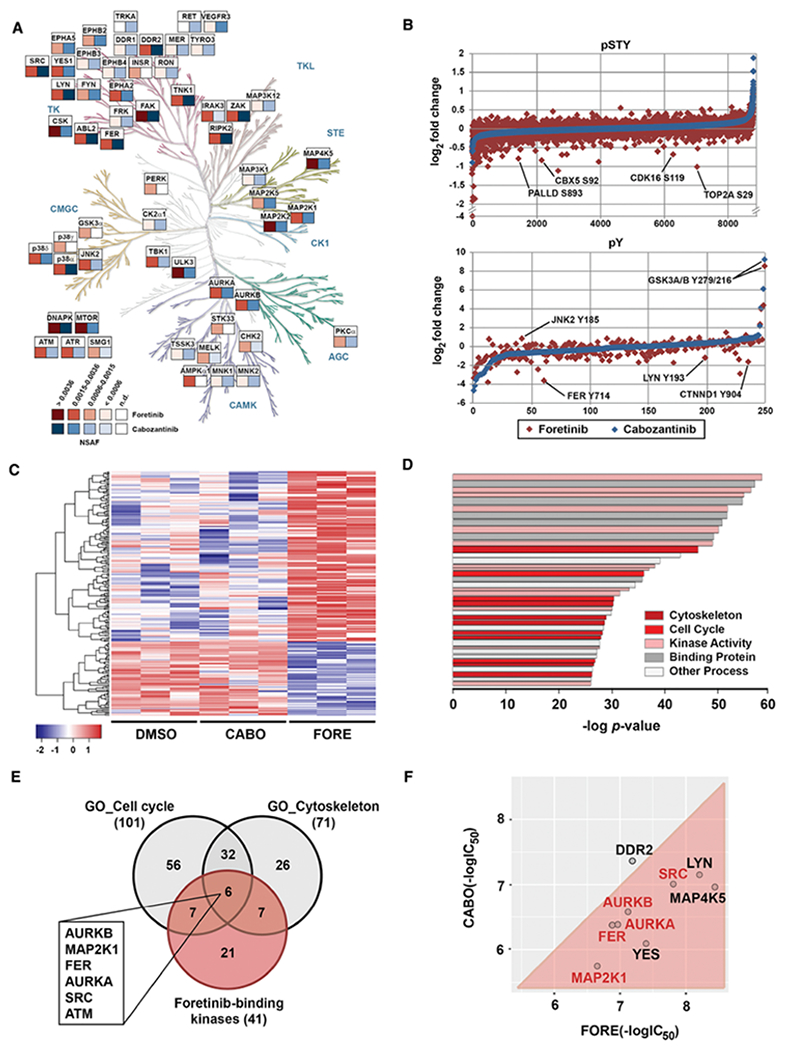
Figure 4. Systems pharmacology reveals differential targets and pathways of foretinib and cabozantinib.

(A) Chemical proteomics comparison between foretinib (red) and cabozantinib (blue) kinase targets presenting NSAF > 0.0006 in H1155 cells (see also Figure S4C). Kinome phylogenetic tree adapted courtesy of Cell Signaling Technology, Inc. (www.cellsignal.com).
(B) Global (pSTY) and phosphotyrosine (pY) proteomics data for H1155 cells after 3 hours treatment with 1 μM of foretinib (red) or cabozantinib (blue).
(C) Heatmap representation of RNA-Seq analysis in H1155 cells after 4 hours of treatment with DMSO, cabozantinib (CABO) or foretinib (FORE) at 1 μM. Displayed are the 231 genes that were differentially expressed.
(D) Pathway analysis using GSEA: top 40 pathways assigned with GSEA after combining the specific data. Colors classify pathways into clusters. Bar strength correlates with the number of genes in each pathway.
(E) Venn diagram analysis of foretinib-binding kinases and the most predominant differentially regulated pathways between foretinib and cabozantinib. Highlighted are foretinib-binding kinases that are shared by both pathways
(F) Comparison of in vitro kinase assay IC50 values for foretinib (FORE) and cabozantinib (CABO) for select kinase targets. Displayed are the negative log IC50 values (in M).
