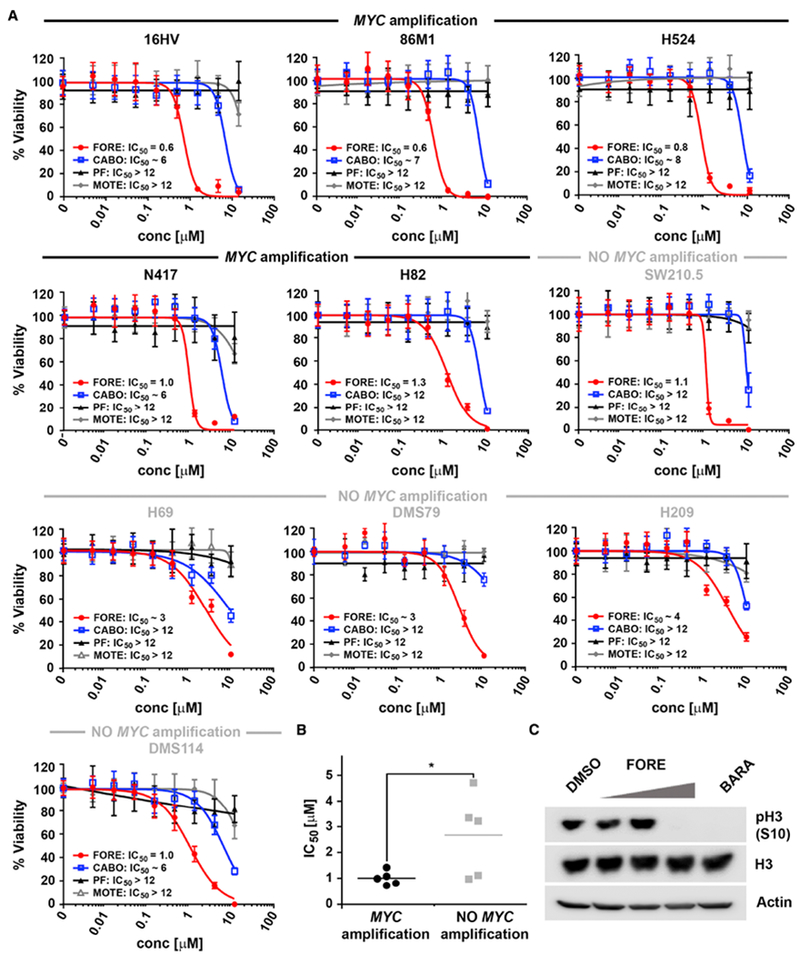
Figure 6. Foretinib, but not cabozantinib, potently kills MYC-amplified SCLC cells.

(A) Dose response curves of foretinib (FORE), cabozantinib (CABO), PF-04217903 (PF) and motesanib (MOTE) for inhibition of viability of various SCLC cell lines with indicated MYC amplification status after 72 hours treatment and the respective IC50 values [μM], n = 2 (H209, N417, DMS114, H69 and DMS79), n = 3 (16HV, 86M1, H524, H82, SW210.5), Data are represented as mean ± SD.
(B) IC50 comparison for inhibition of viability between MYC-amplified and non-MYC-amplified SCLC cells after 72 hours treatment with foretinib. * indicates p value < 0.05 as determined using Student’s t-test.
(C) Western blot of pH3 (S10) in 16HV cells after 6 hours treatment with 0.05, 0.25 and 0.5 μM foretinib (FORE) and 0.05 μM barasertib (BARA). Blots are representative of three independent experiments.
