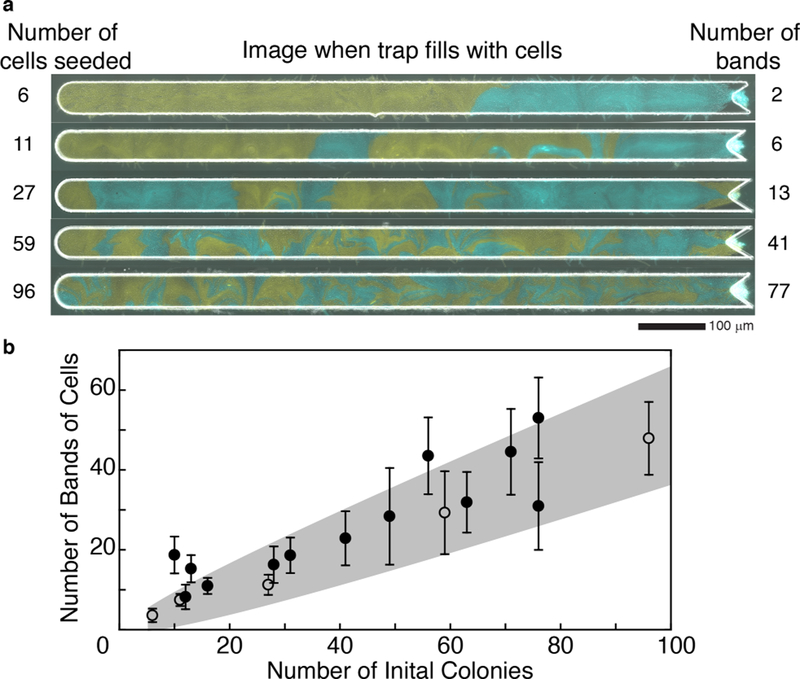
Figure 5: Emergent single-strain banding vs. number of cells seeded into trap.
(a) Images from five representative experiments with two strains grown in the largest open trap at the time the trap fills completely with cells. The number of cells seeded into each trap is given on the left, and the number of bands formed when the trap fills is given on the right. The greater the number of cells seeded into the trap, the more heterogeneous the population. (b) The number of bands (single-strain regions) increases approximately linearly with the number of seeded colonies. The points are from the same experiments shown in Fig. 2. Open dots correspond to the 5 examples shown in panel (a). The predicted range of bands (mean ± 3 s.d.) as a function of seeded cells is shaded in grey (see Supplementary Information).

