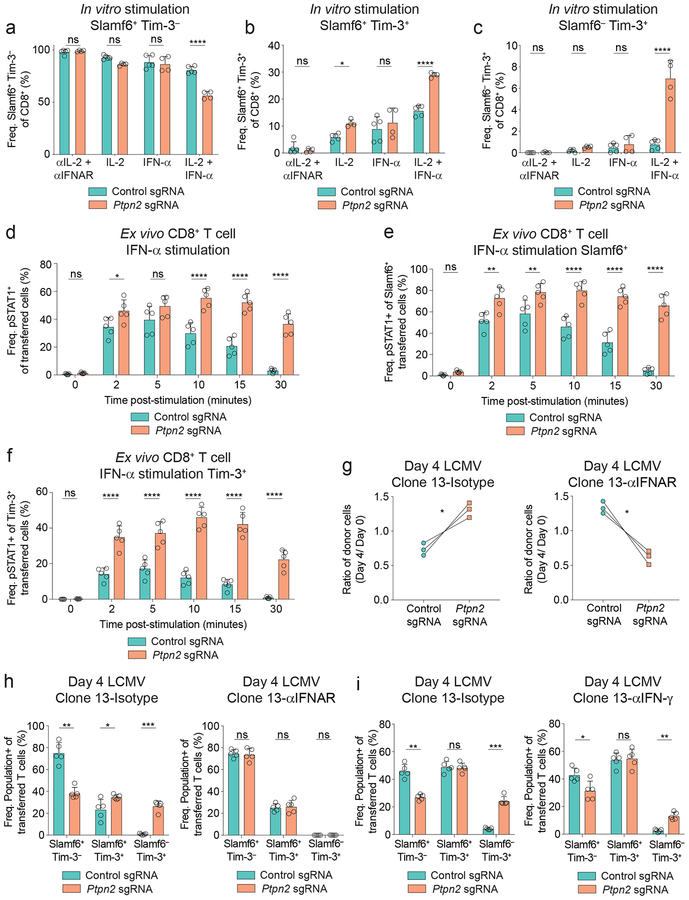
Figure 5: Ptpn2 deletion increases Tim-3+ cell differentiation through enhanced IFN-α signaling.
(a-c) Quantification of (a) Slamf6+ Tim-3–, (b) Slamf6+ Tim-3+, and (c) Slamf6– Tim-3+ subsets following in vitro stimulation (αCD3/CD28) of control or Ptpn2-deleted naive CD8+ T cells in the presence of indicated cytokines or blocking antibodies. Representative of two pooled experiments, n ≥ 4 technical replicates. (d) Quantification of pSTAT1 expression of splenic CD8+ T cells day 6 post LCMV Clone 13 infection for co-transferred control and Ptpn2-deleted cells following ex vivo restimulation with IFN-α. Representative of two independent experiments, n = 5 biological replicates. (e-f) Quantification of pSTAT1 in (e) Slamf6+ or (f) Tim-3+ cells following ex vivo IFN-α restimulation of co-transferred control and Ptpn2-deleted cells as in (d). Representative of two independent experiments, n = 5 biological replicates. (g) Quantification of frequencies of co-transferred control and Ptpn2-deleted CD8+ T cells day 4 post LCMV Clone 13 infection following treatment with isotype (left graph) or IFNAR blocking antibody (right graph). Frequencies at day 4 were normalized to input frequencies at day 0. Representative of two independent experiments, n = 3 biological replicates. (h) Quantification of Slamf6+ Tim-3–, Slamf6+ Tim-3+, and Slamf6– Tim-3+ subsets day 4 post LCMV Clone 13 infection in mice that received co-transferred control and Ptpn2-deleted P14 CD8+ T cells and were treated with isotype (left) or IFNAR blocking antibody (right). Representative of two independent experiments, n = 5 biological replicates. (i) Quantification of Slamf6+ Tim-3–, Slamf6+ Tim-3+, and Slamf6– Tim-3+ subsets day 4 post LCMV Clone 13 infection in mice that received co-transferred control and Ptpn2-deleted P14 CD8+ T cells and were treated with isotype (left) or IFN-γ neutralizing antibody (right). Representative of two independent experiments, n = 5 biological replicates. Bar graphs represent mean and error bars represent standard deviation. Statistical significance was assessed by two-way ANOVA (a-c) or two-sided Student’s paired t-test (d-i) (ns p>.05, * p≤.05, ** p≤.01, *** p≤.001, **** p≤.0001). See also Supplementary Figure 5.

