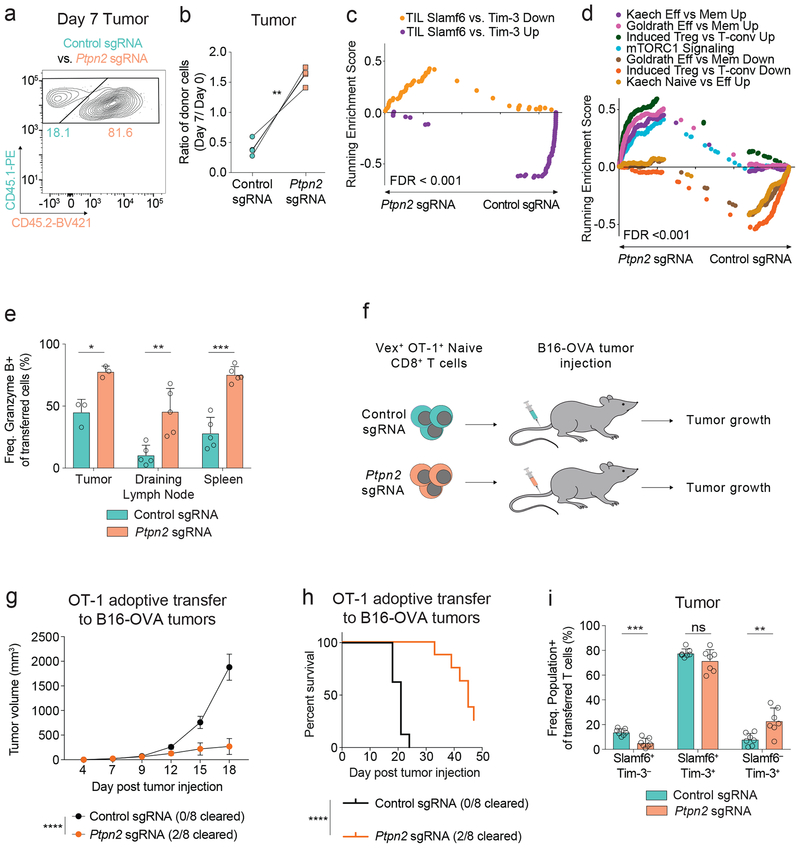
Figure 6: Loss of Ptpn2 enhances Tim-3+ CD8+ T cell differentiation in tumors.
(a) Representative flow cytometry plot of control or Ptpn2-deleted OT-1 T cells in the tumor 7 days post MC38-OVA injection. Representative of two independent experiments, n = 4 biological replicates. (b) Quantification of frequencies of co-transferred control or Ptpn2-deleted CD8+ T cells day 7 post MC38-OVA injection. Frequencies at day 7 were normalized to input frequencies at day 0. Representative of two independent experiments, n = 4 biological replicates. (c-d) (c) GSEA TIL Slamf6+ vs. Tim-3+ Up top 50 and TIL Slamf6+ vs. Tim-3+ Down top 50 signature enrichment and (d) GSEA effector signatures for co-transferred control or Ptpn2-deleted OT-1 T cells in MC38-OVA tumors 7 days post injection. Representative of one experiment, n = 3 pooled mice and 2 technical replicates. (e) Quantification of Granzyme B expression in co-transferred OT-1 CD8+ T cells day 7 post MC38-OVA implantation in the tumor, draining lymph node, and spleen for control and Ptpn2-deleted co-transferred mix as in (a). Representative of two independent experiments, n ≥ 3 mice. (f) Schematic of adoptive transfer of either control or Ptpn2-deleted naive OT-1 CD8+ T cells separately to mice challenged with B16-OVA one day post transfer of T cells. (g) Tumor growth curves for B16-OVA tumors following transfer of naive OT-1 control or Ptpn2-deleted CD8+ T cells separately into WT recipients that were implanted with B16-OVA cells. Representative of two independent experiments, n = 8 mice. (h) Survival curves of mice in (g). Representative of two independent experiments, n = 8 mice. (i) Quantification of Slamf6+ Tim-3–, Slamf6+ Tim-3+, and Slamf6– Tim-3+ subsets day 9 post B16-OVA implantation in the tumor for co-transferred control and Ptpn2-deleted cells as in (a). Representative of two independent experiments, n = 7 mice. Bar graphs represent mean and error bars represent standard deviation (except for g where error bars represent standard error). Statistical significance was assessed by two-sided Student’s paired t-test (b, e, i), two-sided Kolmogorov-Smirnov test (c, d), two-way ANOVA (g), or two-sided log-rank Mantel-Cox test (h) (ns p>.05, * p≤.05, ** p≤.01, *** p≤.001, **** p≤.0001). See also Supplementary Figure 6.

