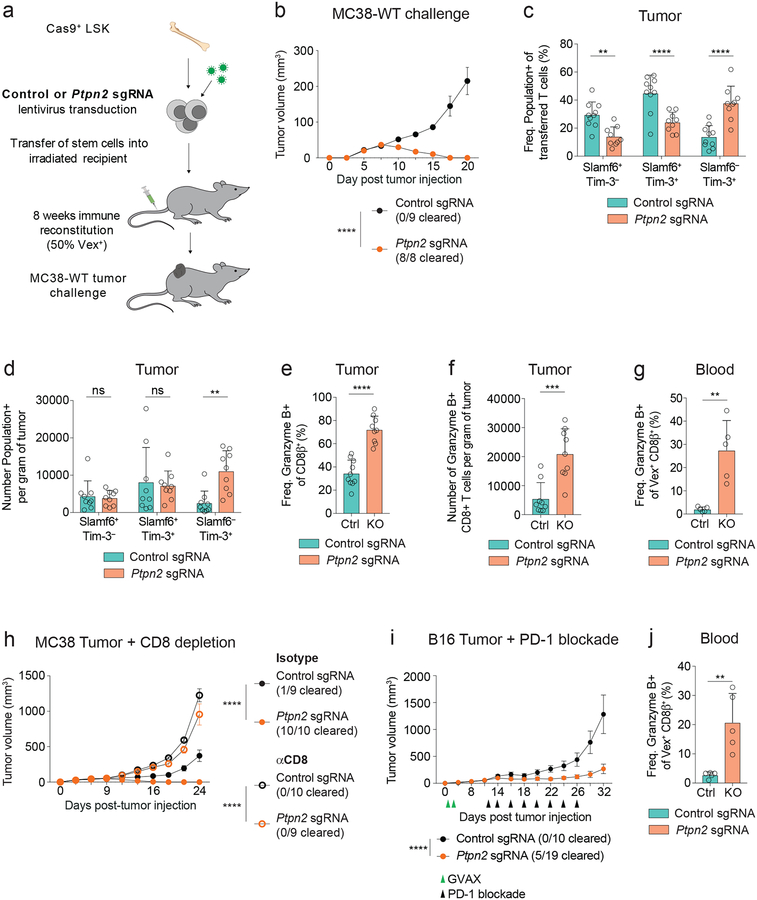
Figure 7: Deletion of Ptpn2 enhances CD8+ T cell responses to tumors and checkpoint blockade efficacy.
(a) Schematic for MC38-WT tumor challenge in chimeric mice where approximately 50% of immune cells express a control sgRNA or a Ptpn2-targeting sgRNA. (b) Tumor growth curves for control or Ptpn2-deleted chimeric mice following 1 × 10⁶ cell MC38-WT challenge. Representative of two independent experiments, n ≥ 8 mice. (c-d) Quantification of (c) frequency and (d) number of Slamf6+ Tim-3–, Slamf6+ Tim-3+, and Slamf6– Tim-3+ subsets in CD8+ T cells infiltrating day 9 MC38 tumors in control or Ptpn2-deleted bone marrow chimeras. Representative of two independent experiments, n ≥ 9 mice. (e-f) Quantification of (e) frequency and (f) number of Granzyme B-expressing CD8+ T cells infiltrating day 9 MC38 tumors implanted in control or Ptpn2-deleted bone marrow chimeras. Representative of two independent experiments, n ≥ 9 mice. (g) Quantification of frequency of Granzyme B+ CD8+ T cells from the blood of control or Ptpn2-deleted bone marrow chimeras day 14 post MC38 tumor implantation, pregated on CD8β+ Vex+ cells. Representative of two independent experiments, n = 5 mice. (h) Tumor growth curves for mice as in (a) challenged with 1 × 10⁶ MC38-WT tumor cells following treatment with CD8-depleting antibody or isotype control. Representative of two independent experiments, n ≥ 9 mice. (i) Tumor growth curves for control or Ptpn2-deleted bone marrow chimeras challenged with 1 × 10⁶ B16 tumor cells treated with GVAX (green triangles) on days 1, 4 and αPD-1 (black triangles) on days 12, 14, 16, 18, 20, 22, 24, and 26. Representative of two independent experiments, n ≥ 9 mice. (j) Quantification of frequency of Granzyme B+ CD8+ T cells from the blood of chimeras in (i) day 14 post B16 tumor implantation, pregated on CD8β+ Vex+ cells. . Representative of two independent experiments, n = 5 mice. Bar graphs represent mean and error bars represent standard deviation (except for b, h, i where error bars represent standard error). Statistical significance was assessed by two-way ANOVA (b-d, h-i), or two-sided Student’s unpaired t-test (e-g, j) (ns p>.05, * p≤.05, ** p≤.01, *** p≤.001, **** p≤.0001). See also Supplementary Figure 7.

