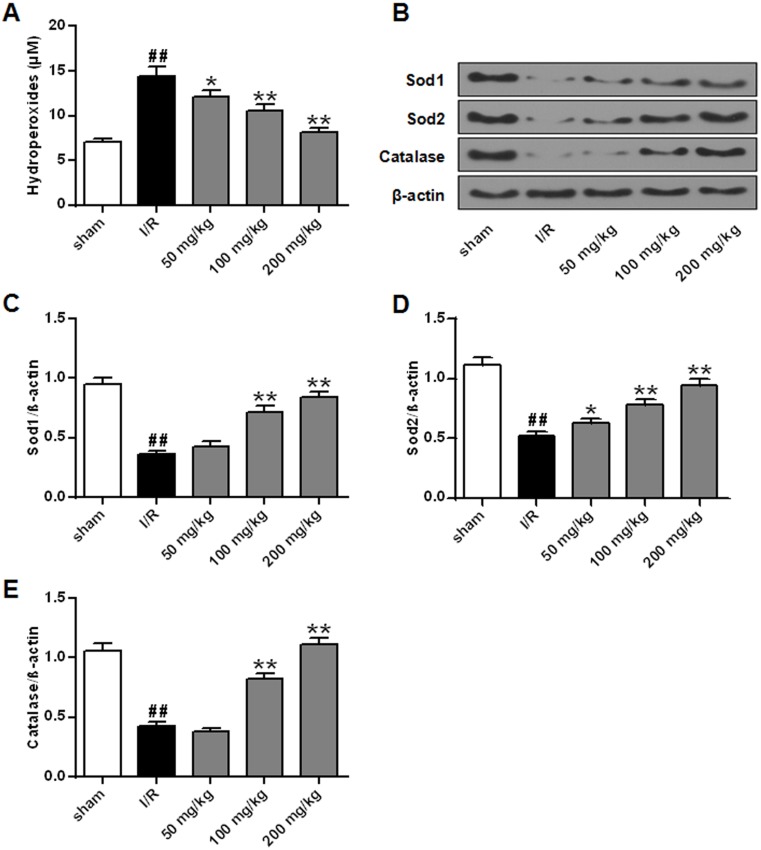
Figure 6.
Effects of galuteolin on oxidative stress in cerebral infarction of rats. (A) Determination of the level of LPO in rat brain tissue by LPO kit. (B) Determination of the expression levels of Sod1, Sod2, and catalase by Western Blot. (C) Histogram of Sod1 protein expression. (D) Histogram of Sod2 protein expression. (E) Histogram of catalase protein expression. The β-actin as a standard internal reference.
Notes: n=6, compared with the I/R group p, *P<0.05, **P<0.01; compared with the sham group, ## P<0.01.

