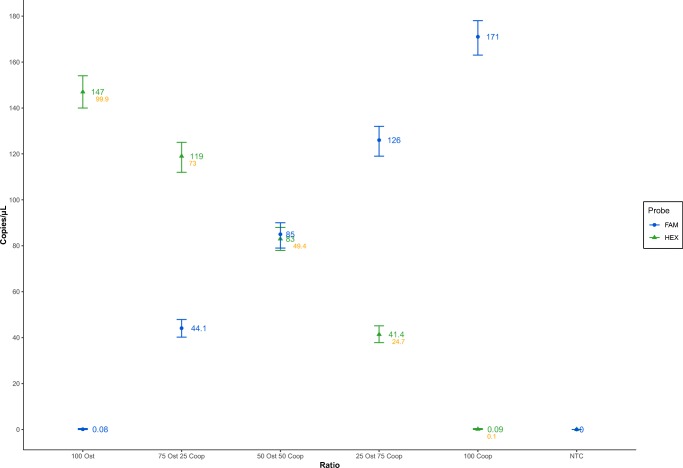
Fig. 3.
Fractional abundance (FA) precision test. Ostertagia and Cooperia DNA samples of similar concentrations were mixed in equal volumes at different ratios (1:0, 3:1, 1:1, 1:3, and 0:1) to evaluate the capacity of the technique to determine the FA of each parasite genus DNA at every dilution ratio and produce an anticipated linear dilution pattern. Blue filled dots correspond to the copy number of Cooperia DNA in the initial sample, while green filled triangles correspond to the copy number of Ostertagia DNA. Values displayed in orange represent the FA index for Ostertagia DNA copy number

